Types Of Statistical Analysis
One of the things that many people don’t know is that statistics is used in many different areas. Some of them may not even come to your mind when you think about it. Some examples include data analysis, financial analysis, business intelligence, market research, and many more. But why does this matter? Why is this important?

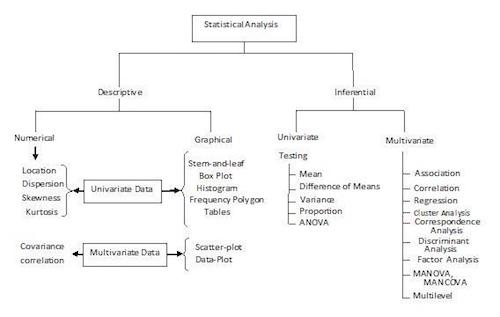
The truth is that statistics is the basis for many business decisions every single day. However, statistical analysis can be divided into two main types of statistical analysis – descriptive and inferential.
Types Of Statistical Analysis
When you are analyzing information in the real world, you can use both descriptive as well as inferential statistics. The reality is that in many research done on groups of people like marketing research, for example, you can use both types of statistical analysis not only to analyze results but also to come up with conclusions. So, let’s check each type in more detail.
Check our our standard error calculator.
#1: Descriptive Statistics:

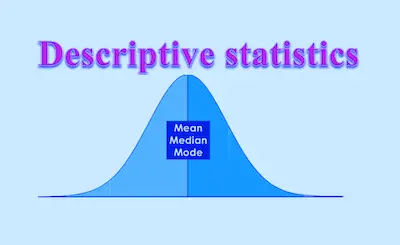
Simply put, descriptive statistics is mainly used to describe the basic features of information and then show or summarizes all the data in a rational way. So we can then state that descriptive statistics studies quantities.
Notice that descriptive statistics uses the data from a specific population or a sample of it. As you already know, the population is a group. So, it can include numbers, tables, charts, graphs, and present raw data.
One of the main aspects to keep in mind about descriptive statistics is that it doesn’t make any conclusions. The reality is that you’re not able to get conclusions as well as you won’t also be able to make generalizations beyond the data that you are considering. So, simply put, within the descriptive analysis, you can only describe what is and what the data shows.
Looking to determine the standard error?
Here’s an example. Imagine a population of 30 workers in a business department. And at this point, you want to discover the average of that data set for 30 workers. However, you can’t discover what the eventual average is for all the workers in the whole company using just that data. Imagine, this company has 10 000 workers.
Despite that, this type of statistics is very important because it allows us to show data in a meaningful way. It also can give us the ability to make a simple interpretation of the data.
In addition, it helps us to simplify large amounts of data in a reasonable way.
Make sure to learn more about the standard error.
#2: Inferential Statistics:

Inferential statistics is a bit more complicated than descriptive statistics. Simply put, inferential analysis allows you to infer trends about a larger population based on samples of subjects taken from it.
So, as you can easily understand, this type of analysis allows you to study the relationships between variables within a sample, you can make conclusions, generalizations, and even predictions about a bigger population.
One of the main advantages of using inferential analysis is the fact that it allows organizations and businesses to test a hypothesis and come up with conclusions about the data they have in hand. And this is quite helpful since in most cases, it is too expensive to study the entire population of people or objects.