The Chi-Square Goodness Of Fit Test
In case you never heard about the chi-square goodness of fit test before, you need to know that this is the test that should be applied when you have one categorical variable from one single population. The chi-square goodness of fit test is usually used to determine if the sample data is consistent with the distribution that was hypothesized.
Make sure to try out our free stats tables and calculators.

Let’s say that some company decided to print some baseball cards. They state that about 30% of their cards are rookies, about 60% of their cards ate veterans but not All-Stars, and about 10% of their cards were veteran All-Stars.
If you decide to pick a random sample of these baseball cards and you use the chi-square goodness of fit test, you will be able to determine if your sample distribution differed significantly from the distribution that the company said it had.
When Should You Use The Chi-Square Goodness Of Fit Test
There are some specific situations when you should consider using the chi-square goodness of fit test. These include:
– When the variable that you want to study is categorical
– When the sampling method that is used is a simple random sampling.
– When the expected value of the number of sample observations in each degree of the variable is at least 5.
Use our calculator to determine the critical chi-square value.
Conducting The Chi-Square Goodness Of Fit Test
When you want to perform the chi-square goodness of fit test, you need to understand that it requires four different steps:
Step #1: State The Hypothesis
When you are conducting a hypothesis test like the chi-square goodness of fit test, you need to have a null hypothesis (Ho) and an alternative hypothesis (Ha). You need to ensure that when you formulate them, they are mutually exclusive. This means that if one of the hypothesis is true, the other hypothesis needs to be false, and vice-versa.
For a chi-square goodness of fit test, you should use the following hypothesis:
– Ho: The data is consistent with the specified distribution
– Ha: The data isn’t consistent with the specified distribution
Discover a reliable tool for chi square test online.
Step #2: Formulate Your Analysis Plan
During this step, you will need to specify some elements:
– The Significance Level: While most researchers tend to use significance levels of 0.01, 0.05, or 0.10, you can use any value between 0 and 1.
– The Test Method: You will need to state that you are going to use the chi-square goodness of fit test to determine if the observed sample frequencies differ significantly from the expected frequencies specified within your null hypothesis.
Step #3: Analyze The Sample Data

Now, it is time to proceed with the calculations. During this step, you will need to take your sample data and determine:
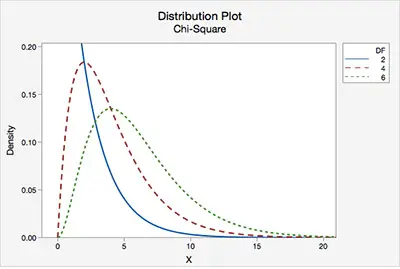
– The Degrees Of Freedom: This is equal to the number of levels (k) of the categorical variable minus 1
DF = k – 1
Learn how to find the Z score.
– The Expected Frequency Counts: When you look at these for each level of the categorical variable, you will see that these are equal to the sample size times the hypothesized proportion from the null hypothesis
Ei = n*p*i
where,
Ei = expected frequency count for the ith level of the categorical variable
n = total sample size
pi = hypothesized proportion of observations in level i.
– The Test Statistic: This one is defined by the equation:
Χ2 = Σ [ (Oi – Ei)2 / Ei ]
where,
Oi = observed frequency count for the ith level of the categorical variable
Ei = expected frequency count for the ith level of the categorical variable.
– The P Value: The P value is the probability of observing a sample statistics as extreme as the test statistic.
Step #4: Interpret The Results
In the case that your sample findings are unlikely, then you will reject the null hypothesis.