The Different Types Of Correlation
As you probably already know, correlation is a widely used statistical tool. Correlation is a way that you have to measure the relationship between two or more variables that don’t need to be classified or identified as dependent or independent. All that you are looking for is to see or understand if the movement of one variable is followed by the movement of another variable.

Use the best free online stats calculators.
One of the things that you may not know about correlation is that there are different types of correlation.
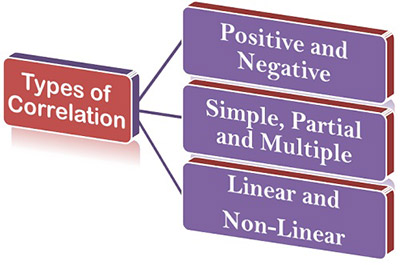
Types Of Correlation
#1: Positive and Negative Correlation:

In order to determine if the correlation is positive or negative, you will need to check the direction of the change.
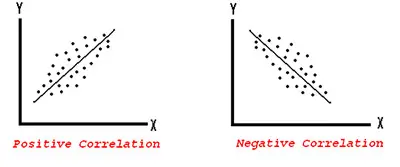
So, you can say that the correlation is positive when all the variables move in the same direction. This means that if one of the variables increases, you will see the other one increase as well. In case one of the variables decreases, the other one decreases as well.
Discover the main sources of data in statistics.
You can say that the correlation between two variables is negative when they move in opposite directions. This means that you have a negative correlation when a variable is increasing and the other one is decreasing or vice-versa.
#2: Simple, Partial and Multiple Correlation:

When you are trying to determine if the correlation is simple, partial or multiple, you will now need to look at the number of variables that you are studying.
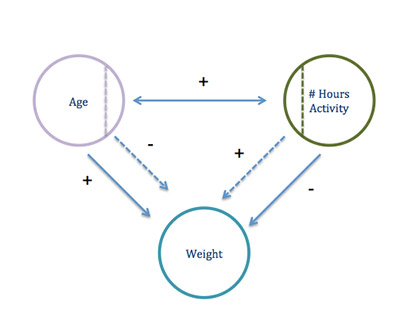
You can say that the correlation is simple when you are only studying two variables. In case you are studying three or more variables, you can have a partial or a multiple correlation. In case you are studying three variables simultaneously (at the same time), you can say that the correlation is multiple.
Learn more about the ANOVA F value.
#3: Linear and Non-Linear (Curvilinear) Correlation:

When you are trying to determine the types of correlation and you want to check if the correlation between variables is linear or non-linear, you will need to look at the constancy of the ratio of change between the two variables you are analyzing.
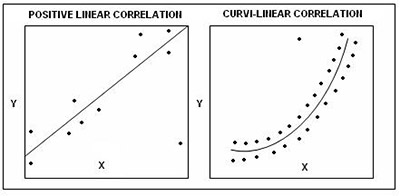
You can say that you are using a linear correlation when the amount of change in one of the variables to the amount o change in the other variable is near a constant ratio.
Let’s say that you have the following sets of data for two different variables:
Variable X: 10 20 30 40 50
Variable Y: 20 40 60 80 100
As you can see, when you are comparing the variables X and Y, you can easily see that the ratio of change between them is the same.
Check out this F test example.
On the other hand, you can say that you are dealing with a non-linear or curvilinear correlation when the amount of change in one variable is not a constant ratio to the amount of change in the other variable.
Conclusion
As you can easily see, you have mainly three different types of correlation. The way that you determine the correlation type depends on whether you are looking at the movement of the variables, to the number of variables you are analyzing, or to the ratio of change between the variables.