Category : Correlation

What Is A Partial Correlation?

Correlation isn’t something new to you that are studying statistics. But what about partial correlation?

partial-correlation

Let’s take a look at an example so you can fully understand this concept. Imagine that you are trying to lose some weight. So, you will try to change your diet and do exercise at the same time. To ensure that you are covering all aspects, you use an app to keep track of how much you eat and how much exercise you do besides your weight. However, while dieting may be something most people are willing to do, we can’t say the same about exercise. Between the lack of time, not finding a sport you like, lack of motivation, or anything else, you just don’t like to exercise. So, the question that you ask yourself is: if you just change your diet, do you need to exercise as well? Well, to answer this question, you need to use partial correlation, a statistical method. 

Looking for the best statistic calculators online?

Partial Correlation

Simply put, a partial correlation is just the correlation between 2 variables when a third variable is held constant. 

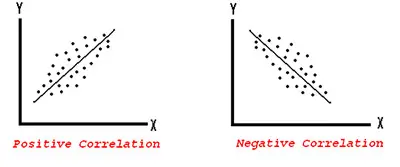
As we mentioned above, you know that there is a correlation between diet and exercise which is a positive correlation. After all, this means that the better you diet, the more weight you will lose. So, what about the relationship between exercise and weight loss? 

As you can easily understand, the relationship between these two variables is negative. While it sounds bad, it really isn’t since the more exercise you do, the more weight you will lose. 

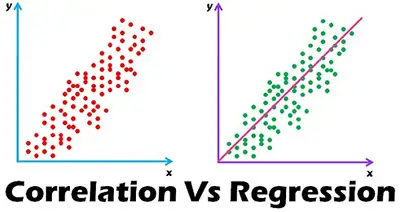
Discover the difference between association and correlation.

But what you are trying to get is a complete picture of how both diet and exercise correlate to weight loss. So, in this case, you need to consider the effect exercise has on dieting and weight loss. This is where the partial correlation is useful.

relationship-between-diet-and-weight-loss

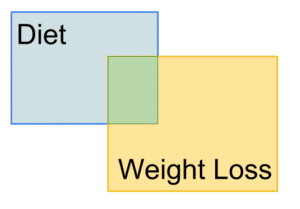
This image shows the relationship between diet and weight loss. The shaded region would be the correlation between these two variables.

relationship-between-exercise-and-weight-loss

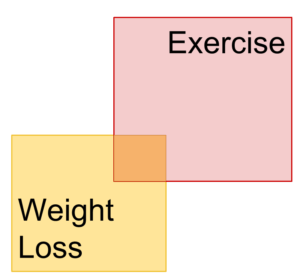
This image shows the relationship between exercise and weight loss. The orange region represents the correlation between the two variables.

relationship-between-diet-exercise-and-weight-loss

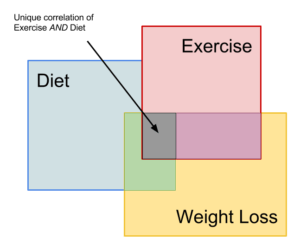
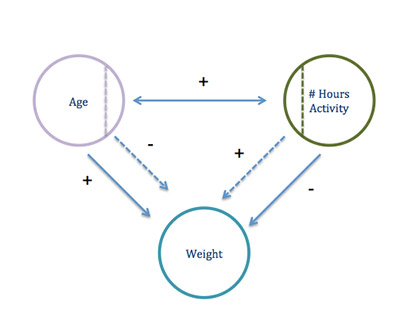
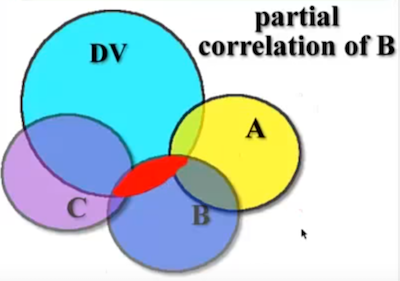
This is the image that represents what you are after. As you can see, the grey region represents the overall correlation between the three variables. The orange and green shaded regions are still there. These indicate the partial correlations that still explain some of the weight loss; however, the grey region is how they both explain what is going on with weight loss.

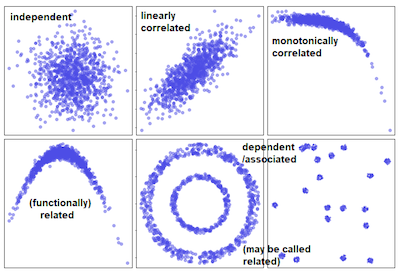
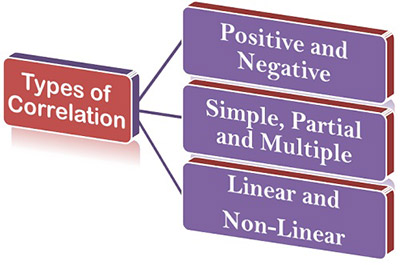
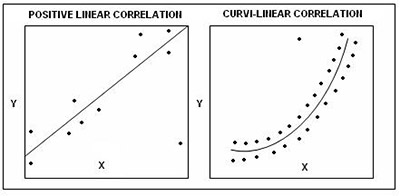
These are the different types of correlation.

What Do Partial Correlations Do?

As you probably already know, multiple regression is one way to explain patterns in data using multiple variables. However, these aren’t the same as partial correlations. Remember that multiple regression is a way of explaining how individual variables explain relationships. Partial correlations explain how variables work together to explain patterns in the data.

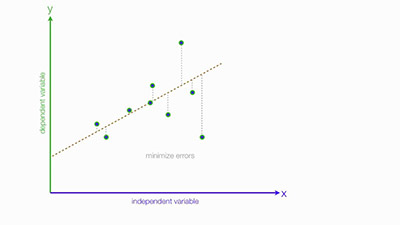
Discover the difference between correlation and linear regression.

The main benefit of using partial correlations is that they allow you to explain patterns in data. For example, in education, there are different types of engagement (cognitive, behavioral, and emotional if you’re interested) that overlap to affect learning. In movies, the amount of romance, action, and comedy in a movie work together to affect box office sales. All of these could be analyzed with partial correlations.

Ultimately, partial correlations are a way to explain patterns in the data using multiple variables. In this case, you look for how multiple variables overlap to explain patterns in the data and come up with a more accurate and reliable model. 


The Difference Between Association and Correlation

One of the questions many statistics students have is to know the difference between association and correlation. The truth is that many believe that association and correlation are the same thing or mean the same thing. However, and even though this may sound a silly question, the truth is that both concepts can make arise the similarity or difference between the two concepts. 

association and correlation

Understanding statistics in 2020.

The reality is that this confusion can be understood because in regular English, correlated and associated at both related to the same thing. On the other hand, in technical terms, correlation is the strength of association as measured by a correlation coefficient. In what concerns to

association, this is not a technical term at all. It simply means the presence of a relationship: certain values of one variable tend to co-occur with certain values of the other variable.

Looking for a standard error calculator?

One of the things that you need to keep in mind is that correlation coefficients vary between -1 and 1. When they are equal to -1, this means that there is a perfect negative relationship: high values of one variable are associated with low values of the other. Likewise, a correlation of +1 describes a perfect positive relationship: high values of one variable are associated with high values of the other. When the correlation coefficients are equal to zero, this means that there is no relationship. The same is saying that high values of one variable co-occur as often with high and low values of the other.  There is no independent and no dependent variable in a correlation. It’s a bivariate descriptive statistic.

correlation

The most common correlation coefficient is the Pearson correlation coefficient. Often denoted by r, it measures the strength of a linear relationship in a sample on a standardized scale from -1 to 1.

It is so common that it is often used synonymously with correlation.

Check out our standard error online calculator.

Notice that Pearson’s coefficient assumes that both variables are normally distributed. This requires they be truly continuous and unbounded.

But when you’re interested in relationships of non-normally distributed variables, you should use other correlation coefficients that don’t require the normality of the variables. Some include the Spearman rank correlation, point-biserial correlation, rank-biserial correlation, tetrachoric, and polychoric correlation.

Notice that there are still other measures of association that don’t have those exact same properties. They tend to be often used where one or both of the variables is either ordinal or nominal. These tend to include measures such as phi, gamma, Kendall’s tau-b, Stuart’s tau-c, Somer’s D, and Cramer’s V, among others.

Here’s how to calculate standard error online.

Bottom Line

different types of correlation

The most important thing that you need to keep in mind is that there is a difference between association and correlation. Besides, you also need to be aware that there are many different measures of association. However, only some of these are correlations. 

Notice that while we are clearly establishing a difference between association and correlation, there isn’t really a consensus between researchers and analysts in this matter. So, you should always clearly explain what you mean with both association and correlation to avoid any misinterpretations.


The Different Types Of Correlation

As you probably already know, correlation is a widely used statistical tool. Correlation is a way that you have to measure the relationship between two or more variables that don’t need to be classified or identified as dependent or independent. All that you are looking for is to see or understand if the movement of one variable is followed by the movement of another variable. 

types-of-correlation

Use the best free online stats calculators.

One of the things that you may not know about correlation is that there are different types of correlation. 

Types Of Correlation

#1: Positive and Negative Correlation:

Positive-and-Negative-Correlation

In order to determine if the correlation is positive or negative, you will need to check the direction of the change. 

So, you can say that the correlation is positive when all the variables move in the same direction. This means that if one of the variables increases, you will see the other one increase as well. In case one of the variables decreases, the other one decreases as well. 

Discover the main sources of data in statistics.

You can say that the correlation between two variables is negative when they move in opposite directions. This means that you have a negative correlation when a variable is increasing and the other one is decreasing or vice-versa. 

#2: Simple, Partial and Multiple Correlation: 

Simple,-Partial-and-Multiple-Correlation

When you are trying to determine if the correlation is simple, partial or multiple, you will now need to look at the number of variables that you are studying. 

You can say that the correlation is simple when you are only studying two variables. In case you are studying three or more variables, you can have a partial or a multiple correlation. In case you are studying three variables simultaneously (at the same time), you can say that the correlation is multiple. 

Learn more about the ANOVA F value.

#3: Linear and Non-Linear (Curvilinear) Correlation: 

Linear-and-Non-Linear-(Curvilinear)-Correlation

When you are trying to determine the types of correlation and you want to check if the correlation between variables is linear or non-linear, you will need to look at the constancy of the ratio of change between the two variables you are analyzing. 

You can say that you are using a linear correlation when the amount of change in one of the variables to the amount o change in the other variable is near a constant ratio. 

Let’s say that you have the following sets of data for two different variables:

Variable X: 10 20 30 40 50

Variable Y: 20 40 60 80 100

As you can see, when you are comparing the variables X and Y, you can easily see that the ratio of change between them is the same. 

Check out this F test example.

On the other hand, you can say that you are dealing with a non-linear or curvilinear correlation when the amount of change in one variable is not a constant ratio to the amount of change in the other variable. 

Conclusion

As you can easily see, you have mainly three different types of correlation. The way that you determine the correlation type depends on whether you are looking at the movement of the variables, to the number of variables you are analyzing, or to the ratio of change between the variables. 


Understanding The Difference Between Correlation And Linear Regression

When you are learning about statistics, there are two concepts that you usually learn at the beginning – correlation and linear regression. However, according to our experience, we believe that most people don’t quite understand the difference between these two concepts. So, we decided to give you a hand so that you can finally see the difference. 

Discover the best online statistic calculators.

Correlation

correlation

Correlation is simply a measure of association between two different variables. These are just known as variables and they can’t be designated either as independent or dependent. 

Simple Regression

When you are looking to establish a link or a connection between a dependent variable and the independent variable, the process is called simple regression. So, when you do this analysis, you will then use the regression statistics to try to predict the dependent variable when you already know the independent variable. So, as you can see, linear regression goes beyond correlation. It doesn’t only determine the relationship between a dependent variable and the independent one as it uses the data to predict the dependent one. 

linear-regression

Learn more about quantitative reasoning.

One of the things that you may haven’t noticed is that you keep using linear regression on a daily basis. You know that when you go to bed late, you will have a hard time waking up in the morning. If you are a mother, you know that when your child eats a lot of sugar his energy levels will be higher. While you already know this, the linear regression, and more specifically the quantitative regression, allows you to add precision by using a mathematical formula. 

Let’s say that a medical researcher is trying to determine the best dose for a new drug depending on body weight. In this case, the body weight is the independent variable and the dose for the new drug is the dependent variable. 

These are the best introductory statistics books.

By doing a linear regression, the medical researcher is trying to determine a formula that fits the relationship between the two variables. As soon as they get to the formula, they will be able to recommend the right dose for a specific body weight. 

The Type Of Data

correlation-vs-regression

The type of data is also an important factor to take into consideration. The truth is that when you are looking at correlation, this is almost always used to measure both variables. On the other hand, when you are dealing with linear regression, you know that you need to use it when X is a variable that you can manipulate. This can be concentration, time, among others. 

Don’t know how to calculate P value from Z by hand?

The Different Types Of Variables

As we already mentioned above, when you are looking at correlation, you don’t classify the variables as dependent or independent. There is no cause or effect.

However, when you are looking at linear regression, there is the need to be an independent variable and a dependent variable. 

Relationship Between Results

When you are calculating the correlation between two variables, your results will always be between -1 and +1.