Understanding Confidence Intervals
One of the most important statistics concepts is confidence intervals. But what is a confidence interval after all?
Simply put, a confidence interval refers to the probability that a population parameter will fall between two set values for a certain proportion of times. So, we can then say that confidence intervals measure the degree of uncertainty or certainty in a sampling method.

It’s always important to keep in mind that a confidence interval can take any number of probabilities, with the most common being a 95% or 99% confidence level.
Discover the best statistics calculators online.
Why We Need Confidence Intervals
When you are learning a new concept for the first time, you often question yourself about what’s the point in learning it. Well, in the case of confidence intervals, statisticians look at them to measure uncertainty.

Here’s a simple example: a researcher chooses different samples randomly from the same population and computes a confidence interval for each sample. As you can easily understand, the resulting datasets are all different. The reality is that some intervals include the true population parameter and others do not.
Check out our confidence interval calculation for population mean.
So, in sum, a confidence interval is simply a range of values that likely would contain an unknown population parameter. So, ultimately, a confidence interval refers to the percentage of probability, or certainty, that the confidence interval would contain the true population parameter when you draw a random sample many times.
Should confidence intervals or tests of significance be used?
Calculating A Confidence Interval

Let’s say that some researchers are studying the heights of high school softball players. The first thing they will do is to take a random sample from the population (the team of softball players) and let’s imagine that they establish a mean height of 74 inches.
The mean of 74 inches is a point estimate of the population mean. The truth is that you can’t actually use this point estimate by itself because it does not reveal the uncertainty associated with the estimate. So, you are missing the degree of uncertainty in this single sample.
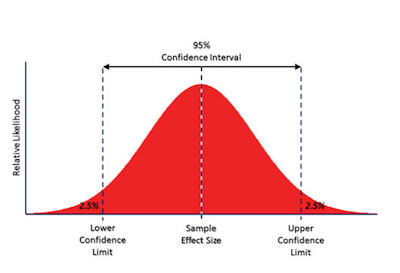
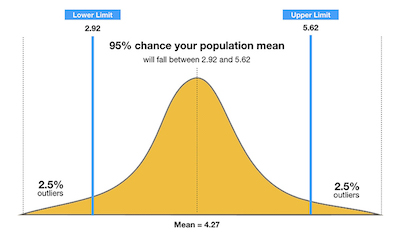
The reality is that confidence intervals deliver more information than point estimates. After all, by establishing a 95% confidence interval using the sample’s mean and standard deviation, and assuming a normal distribution as represented by the bell curve, the researchers arrive at an upper and lower bound that contains the true mean 95% of the time.
Discover how to find a confidence interval.
Let’s say that the interval is between 72 inches and 76 inches. If the researchers take 100 random samples from the population of high school softball players as a whole, the mean should fall between 72 and 76 inches in 95 of those samples.
Besides, in the case that the researchers want even greater confidence, they can expand the interval to 99% confidence. Doing so will create a broader range, as it makes room for a greater number of sample means.
So, if they establish the 99% confidence interval as being between 70 inches and 78 inches, they can expect 99 of 100 samples evaluated to contain a mean value between these numbers. A 90% confidence level means that we would expect 90% of the interval estimates to include the population parameter. Likewise, a 99% confidence level means that 95% of the intervals would include the parameter.