Category : Confidence Interval

Understanding Confidence Intervals

One of the most important statistics concepts is confidence intervals. But what is a confidence interval after all?

Simply put, a confidence interval refers to the probability that a population parameter will fall between two set values for a certain proportion of times. So, we can then say that confidence intervals measure the degree of uncertainty or certainty in a sampling method. 

confidence-intervals

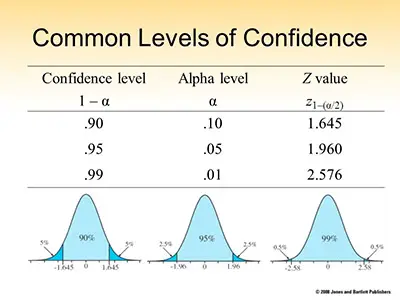
It’s always important to keep in mind that a confidence interval can take any number of probabilities, with the most common being a 95% or 99% confidence level.

Discover the best statistics calculators online.

Why We Need Confidence Intervals 

When you are learning a new concept for the first time, you often question yourself about what’s the point in learning it. Well, in the case of confidence intervals, statisticians look at them to measure uncertainty. 

Why-We-Need-Confidence-Intervals

Here’s a simple example: a researcher chooses different samples randomly from the same population and computes a confidence interval for each sample. As you can easily understand, the resulting datasets are all different. The reality is that some intervals include the true population parameter and others do not.

Check out our confidence interval calculation for population mean. 

So, in sum, a confidence interval is simply a range of values that likely would contain an unknown population parameter. So, ultimately, a confidence interval refers to the percentage of probability, or certainty, that the confidence interval would contain the true population parameter when you draw a random sample many times. 

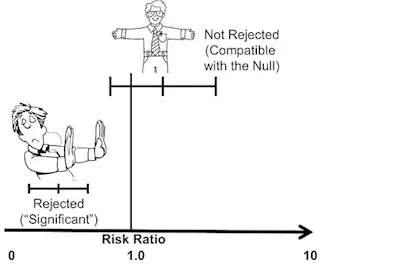
Should confidence intervals or tests of significance be used?

Calculating A Confidence Interval

calculating-a-confidence-interval

Let’s say that some researchers are studying the heights of high school softball players. The first thing they will do is to take a random sample from the population (the team of softball players) and let’s imagine that they establish a mean height of 74 inches. 

The mean of 74 inches is a point estimate of the population mean. The truth is that you can’t actually use this point estimate by itself because it does not reveal the uncertainty associated with the estimate. So, you are missing the degree of uncertainty in this single sample.

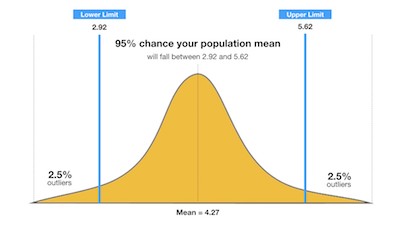
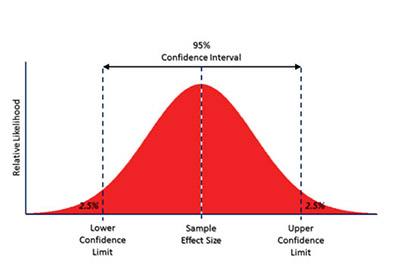
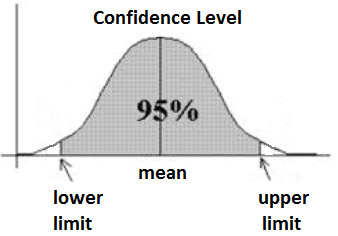
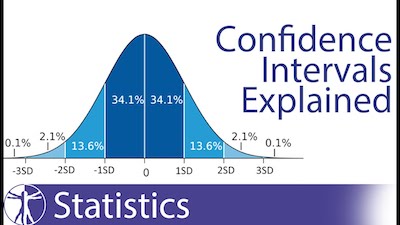
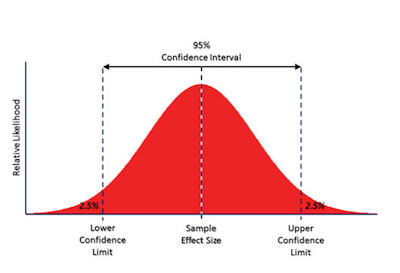
The reality is that confidence intervals deliver more information than point estimates. After all, by establishing a 95% confidence interval using the sample’s mean and standard deviation, and assuming a normal distribution as represented by the bell curve, the researchers arrive at an upper and lower bound that contains the true mean 95% of the time. 

Discover how to find a confidence interval.

Let’s say that the interval is between 72 inches and 76 inches. If the researchers take 100 random samples from the population of high school softball players as a whole, the mean should fall between 72 and 76 inches in 95 of those samples.

Besides, in the case that the researchers want even greater confidence, they can expand the interval to 99% confidence. Doing so will create a broader range, as it makes room for a greater number of sample means. 

So, if they establish the 99% confidence interval as being between 70 inches and 78 inches, they can expect 99 of 100 samples evaluated to contain a mean value between these numbers. A 90% confidence level means that we would expect 90% of the interval estimates to include the population parameter. Likewise, a 99% confidence level means that 95% of the intervals would include the parameter.


Should Confidence Intervals or Tests of Significance be Used?

When you are learning statistics, it is normal that you learn about confidence intervals. But what are confidence intervals?

What Are Confidence Intervals?

confidence intervals

When you use a sample of the population, you are subject to sampling error. After all, as you can easily understand, sample statistics can’t match exactly the population parameters that they estimate. 

Discover the best statistics calculators online. 

Therefore, you need to think that you may have a sampling error. 

One of the things that you can do to deal with sampling error is to simply ignore results if you believe there is a chance that they could be due to sampling error. In case you don’t know, this is the approach that you should use when you are working with significance tests. As a rule of thumb, sample effects are treated as being zero when you have more than 5% or 1% chance they were produced by sampling error. 

Check out our confidence interval calculator for the population mean.

sampling error

However, instead of using significance tests, you may prefer using confidence intervals. In this case, instead of deciding whether a sample data support that the null hypothesis is true, you can, instead, take a range of values of a sample statistic that is likely to contain a population parameter. In this case, a certain percentage of intervals that is referred to as the confidence level will include the population parameter in the long run (over repeated sampling). 

The Interpretation

confidence interval Interpretation

When you are using confidence intervals, then you need to understand that for any given sample size, the wider the confidence interval, the higher the confidence level. On the other hand, a narrower confidence interval or a more precise one needs to use either a lower level of confidence or a larger sample. 

Learn more about the different methods and types of sampling.

Let’s imagine that you have a sample that tells you that 52% of the participants stat they intend to vote for Party Y at the next election. As you can easily see, this figure is merely a sample estimate. 

The reality is that since this percentage came from a sample that has sampling error, then you need to allow a margin of error. So, when you use confidence interval, you can better estimate the interval within which the population parameter is likely to lie. 

As you can easily see, using confidence intervals prevents you from dealing with the confusing logic of null hypothesis testing and its simplistic significant/not significant dichotomy.

If you think about it, confidence intervals are actually a form of inferential analysis and they can be used with many descriptive statistics. These include percentages, correlation coefficients, regression coefficients, and percentage differences between groups. 

Just like tests of significance, confidence intervals always assume that the sample estimate comes from a simple random sample. So, you won’t be able to use them on data from non-probability samples. 


Discover how to find a confidence interval.

Why It Is Better To Use Confidence Intervals Than Significance Tests

Why It Is Better To Use Confidence Intervals Than Significance Tests
  • Confidence intervals provide all the information that a test of statistical significance provides and more. If at the 95 percent confidence level, a confidence interval for an effect includes 0 then the test of significance would also indicate that the sample estimate was not significantly different from 0 at the 5 percent level.
  • The confidence interval provides a sense of the size of any effect. The figures in a confidence interval are expressed in the descriptive statistic to which they apply (percentage, correlation, regression, etc.).
  • Since confidence intervals avoid the term ‘significance’, they avoid the misleading interpretation of that word as ‘important.’ Confidence intervals remind us that any estimates are subject to error and that we can provide no estimate with absolute precision.

How To Find A Confidence Interval

When you are learning statistics, it’s common to hear about a confidence interval. But what exactly is a confidence interval?

Simply put, a confidence interval is a way that you have to know about how much uncertainty there is with any specific statistic. One of the things that you need to keep in mind is that a confidence interval is usually used with a margin of error. 

confidence-interval

Take a look at the different statistical tables that you can use in statistics.

Overall, a confidence interval tells you how confident you can be about the results from a survey or from a poll to reflect what you expect to find if it was possible to do it for the entire population. 

Confidence Intervals Vs. Confidence Levels

One of the things that you need to know is that a confidence interval is directly related to a confidence level. 

confidence-level

A confidence level is usually expressed in terms of a percentage. Most of the times, you will see polls and surveys stating that they used a confidence level of 95%. This means that in case you repeat the exact same survey or poll over and over again, 95% of the time your results will match the results you get from a population. On the other hand, a confidence interval is a result that you get. Ley’s say that you made a quick survey to a small group f pet owners to see how much cans of dog foods they purchase a year. 

If you test your statistics at the 99% confidence level and if you get a confidence interval of (200,300), this means that you believe that these owners will buy between 200 to 300 cans of dog food each year. Besides, you are incredibly confident that this will occur – 99%. 

Learn more about how to conduct a t test in excel.

Applying Confidence Intervals To Real Life Examples

common-levels-of-confidence

The United States Census Bureau usually uses confidence levels of 90% in most of the surveys they do. Back in 1995, they did a survey about the number of people in poverty and they stated that they were using a 90% confidence level. According to them “The number of people in poverty in the United States is 35,534,124 to 37,315,094.” 

Check out this paired t test example.

But what does this mean exactly? 

Simply put, this means that if the United States Census Bureau was about to repeat this same survey over and over again using the same techniques is that 90% of the time, the results would always be between 35,534,124 and 37,315,094 people in poverty. So, we can say that the (35,534,124 to 37,315,094) is the confidence interval.

Confidence Interval – A Simple Example

Let’s say that you have a group of 10 patients who need foot surgery who have a mean weight of 240 pounds. You also know that the sample standard deviation was 25 pounds and that you need to find the confidence interval for a sample to ensure the right mean weight of al foot surgery patients. Consider a 95% confidence interval. 

confidence-level-scale

Discover how you can do an unpaired t test for two samples.

In order to solve this problem, you need to follow the next steps:

Step #1: Determine The Degrees Of Freedom

Take your sample size and subtract one. So, you will get:

10 – 1 = 9

Step #2: Subtract the confidence level from 1, and then divide by 2:

(1 – .95) / 2 = .025

Step #3: Now, you need to look at the answers that you got in both steps 1 and 2 and search for them in the t-distribution table. 

Since you had 9 degrees of freedom and an α = 0.025, your result is 2.262.

Step #4: Now, it is time to divide your sample standard deviation by the square root of your sample size:

25 / √(10) = 7.90569415

Step 5: And now you need to multiply the result you got on step 3 and the result you got on step 4:

2.262 × 7.90569415 = 17.8826802

Step 6: Now, you need to determine both the lower and the upper end of the range:

– The lower end of the range: 

240 – 17.8826802 = 222.117

– The upper end of the range:

240 + 17.8826802 = 257.883

And you just discovered the confidence interval.