Understanding The Binomial Distribution
Simply put, the binomial distribution is a probability distribution that shows you the likelihood that a value will take one of two independent values under a given set of parameters or assumptions.
Take a look at the best statistics calculators online.
When talking about the binomial distribution, it is important to keep in mind that it has some underlying assumptions:
- there is only one outcome for each trial
- each trial has the same probability of success
- each trial is mutually exclusive or independent of each other.
In addition, the binomial distribution is the opposite of a continuous distribution such as the normal distribution. After all, it is a common discrete distribution.
Looking Into The Binomial Distribution

Notice that when you are using the binomial distribution, you need to know that it only counts two different states. generally speaking, these are usually represented by 1 when there is success and by 0 when there is failure.
So, we can then say that the binomial distribution represents the probability for x successes in n trials, given a success probability p for each trial.
When you are using the binomial distribution, you will be summarizing the number of trials or observations when each trial has the same probability of attaining one particular value. The binomial distribution will then determine the probability of observing a specified number of successful outcomes in a specified number of trials.
Understanding the difference between the Z score and the T score.
When To Use The Binomial Distribution

While you can use the binomial distribution in many different situations, it tends to be mainly used in social science statistics as a building block for models for dichotomous outcome variables. Some examples include if someone will die within a specified period of time or even if Democrats or Republicans will win the upcoming election.
Where to get the best statistics help online?
Analyzing The Binomial Distribution
When you want to calculate the expected value of a binomial distribution (or mean), you need to know that you will need to multiply the number of trials by the probability of successes.
Let’s say that the expected value of the number of heads in 50 trials of head and tales is 25 (50 X 0.5).
The mean of the binomial distribution is np, and the variance of the binomial distribution is np (1 − p). This means that:
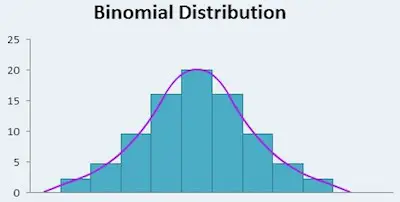
- When p = 0.5, the distribution is symmetric around the mean.
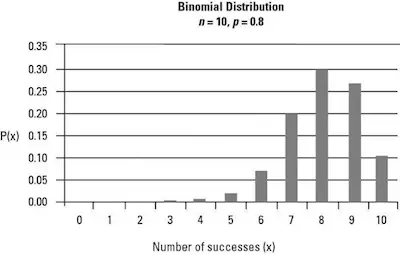
- When p > 0.5, the distribution is skewed to the left.
- When p < 0.5, the distribution is skewed to the right.
Learn how to use descriptive analysis in research.
In addition to this, the binomial distribution is the sum of a series of multiple independent and identically distributed Bernoulli trials. In a Bernoulli trial, the experiment is said to be random and can only have two possible outcomes: success or failure. Flipping a coin is therefore considered to be a Bernoulli trial; each trial can only take one of two values (heads or tails), each success has the same probability (the probability of flipping a head is 0.5), and the results of one trial do not influence the results of another. The Bernoulli distribution is a special case of the binomial distribution where the number of trials n = 1.