Understanding The Difference Between Correlation And Linear Regression
When you are learning about statistics, there are two concepts that you usually learn at the beginning – correlation and linear regression. However, according to our experience, we believe that most people don’t quite understand the difference between these two concepts. So, we decided to give you a hand so that you can finally see the difference.
Discover the best online statistic calculators.
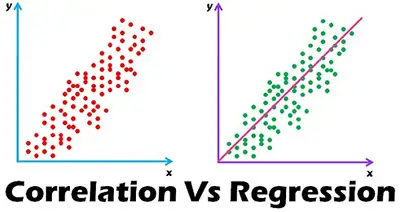
Correlation
Correlation is simply a measure of association between two different variables. These are just known as variables and they can’t be designated either as independent or dependent.
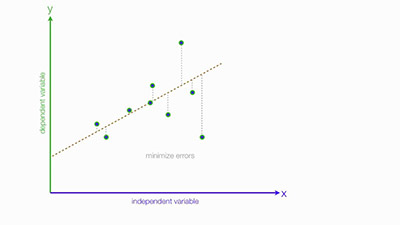
Simple Regression
When you are looking to establish a link or a connection between a dependent variable and the independent variable, the process is called simple regression. So, when you do this analysis, you will then use the regression statistics to try to predict the dependent variable when you already know the independent variable. So, as you can see, linear regression goes beyond correlation. It doesn’t only determine the relationship between a dependent variable and the independent one as it uses the data to predict the dependent one.
Learn more about quantitative reasoning.
One of the things that you may haven’t noticed is that you keep using linear regression on a daily basis. You know that when you go to bed late, you will have a hard time waking up in the morning. If you are a mother, you know that when your child eats a lot of sugar his energy levels will be higher. While you already know this, the linear regression, and more specifically the quantitative regression, allows you to add precision by using a mathematical formula.
Let’s say that a medical researcher is trying to determine the best dose for a new drug depending on body weight. In this case, the body weight is the independent variable and the dose for the new drug is the dependent variable.
These are the best introductory statistics books.
By doing a linear regression, the medical researcher is trying to determine a formula that fits the relationship between the two variables. As soon as they get to the formula, they will be able to recommend the right dose for a specific body weight.
The Type Of Data
The type of data is also an important factor to take into consideration. The truth is that when you are looking at correlation, this is almost always used to measure both variables. On the other hand, when you are dealing with linear regression, you know that you need to use it when X is a variable that you can manipulate. This can be concentration, time, among others.
Don’t know how to calculate P value from Z by hand?
The Different Types Of Variables
As we already mentioned above, when you are looking at correlation, you don’t classify the variables as dependent or independent. There is no cause or effect.
However, when you are looking at linear regression, there is the need to be an independent variable and a dependent variable.
Relationship Between Results
When you are calculating the correlation between two variables, your results will always be between -1 and +1.