Why You Need To Use High-Quality Data
As you already know, data is crucial. And when you are doing data science, you need to do research. Ultimately, you want to ensure that the data that you collect can answer a question, improve a current product, come up with a new one or identify a pattern. So, as you can easily understand, the common factor to all these is that you want to make sure that you use the data to answer a question that you haven’t answered before.
Getting High-Quality Data

When you are trying to answer a question, the first thing you will do is to collect and then store it. However, you need to be careful about the storage process. After all, the state and quality of the data that you have can make a huge amount of difference in both how fast and how accurately you can get your answers. The truth is that if you structure the data for analysis, then you will be able to get your answers a lot faster.
Learn everything you need to know about stats.
The truth is that you can get your data from many different sources and you will need to store it depending on the questions that you want to answer.
Creating research quality data is the way that you refine and structure data to make it conducive to doing science. It means that the data is no longer as general purpose, but it means you can use it much, much more efficiently for the purpose you care about – getting answers to your questions.

Understanding covariance in statistics.
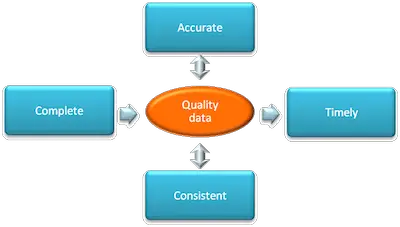
When we talk about research quality, we are referring to data that is easy to manipulate and use, is formatted to work with the tools that you are going to use, is summarized the right amount, has potential biases clearly documented, is valid and accurately reflects the underlying data collection, and combines all the relevant data types you need to answer questions.
One of the things that you need to pay attention to is when you are summarizing the data. The truth is that you need to know what are the most common types of questions that you want to answer as well as the resolution that you need to answer them. With this in mind, you may consider summarizing things at the finest unit of analysis you think you will need – it is always easier to aggregate than disaggregate at the analysis level. Besides, you should also need to ensure that you know what to quantify.
Discover the Chi-square goodness of fit test.
Organizing Data The Right Way

The reality is that one of the main difficulties many people have is related to the organization of the data after they collect it.
Ultimately, you just want to ensure that you can organize your data in a way that allows you to complete frequent tasks quickly and without large amounts of data processing and reformatting.
Discover what you need to know about the F test.

One of the things that you need to know about high-quality data and the ways you have to store it is that each data analytic tool tends to have different requirements on the type of data you need to input. For example, many statistical modeling tools use “tidy data” so you might store the summarized data in a single tidy data set or a set of tidy data tables linked by a common set of indicators. Some software (for example in the analysis of human genomic data) require inputs in different formats – say as a set of objects in the R programming language. Others, like software to fit a convolutional neural network to a set of images, might require a set of image files organized in a directory in a particular way along with a metadata file providing information about each set of images.