Z Score Table (same as Standard Normal Distribution Table
Use this standard normal distribution table (same as z score table, z table, normal distribution table or z chart) to find an area between the mean and Z score standard deviation. For negative negative z score table values just add a “-” sign.

You can also use this z score calculator to generate a z score
Related Calculators
Z-Score Calculator Two-Tailed Area Under the Standard Normal Distribution Calculator Standard Deviation CalculatorWhat Is A Z Score Table?
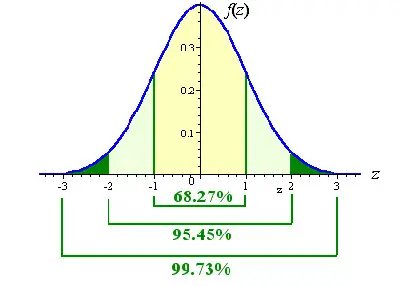
Simply put, a z score table which is also known as the standard normal table is a table that allows you to know the percentage of values below (to the left) a z score is in a standard normal distribution.
Notice that it is important that you keep in mind that a z score (which is also known as the standard score) is a value that indicates the number of standard deviations a raw score has above or below the mean.
Use our z score calculator to confirm your results.
It is also worth to point out that when you need to calculate the mean of the z score, it will always be equal to zero as well as the standard deviation or variance will always be in increments of one.
How To Use A Z Table To Find The Area To The Left Of A Positive Z Score
One of the things that you need to know about the z score table is that this table shows the percentage of values using, in most cases, a decimal figure). Notice that these values to the left of a given z score on a standard normal distribution.
Let’s see an example. Let’s imagine that you got a z score of 1.09. So, the first thing that you will need to do is to look at the left of the side column of the z table to discover the value corresponding to one decimal place of the z-score. For example, the whole number and the first digit after the decimal point).
Discover everything you need to know about normal distribution.
In this example that we are considering, this number is 1. Then, you will need to look up at the remaining number across the table on the top. In this case, we are looking for the 0.09. Som you can then easily see that the corresponding area is 0.8621 which translates into 86.21% of the standard normal distribution being below (or to the left) of the z-score.
How To Use A Z Table To Find The Area To The Right Of A Positive Z Score
Again, when you are trying to find the area to the right of a positive z score, you will need to start reading off the area in the z score table for normal distribution.
Considering that the total area under the bell curve is always 1 (which is equivalent to say that is 100%), you will need to subtract the area from the z score table for normal distribution from 1.
Let’s continue with the same example and say that you have a z score of 1.09. So, since you are trying to find the area to the right of a positive z score, you will need to:
1 – 0.8621. = 0.1379, since you already knew that 0.8621 was the area to the left of z = 1.09.
Take a look at the normality tests for statistical analysis.
How To Use A Z Table To Find The Area To The Left Of A Negative Z Score
Many students usually deal with many difficulties when they see a negative z score. However, you just need to keep in mind that you can disregard the negative sign and then simply subtract the area from the table from 1.
How To Use A Z Table To Find The Area To The Right Of A Negative Z Score
Again, and just like what we explained in the above case, when you have a negative z score, you can disregard the negative sign.
How To Find The Area Between Two Z Scores?
When you are trying to find the area between two negative z scores, you will need to perform a few more calculations. The truth is that you will be trying to discover the area or proportion of the standard normal distribution to the left of the lowest z score value as well as the area or proportion of the standard normal distribution to the right of the highest z score value.
As soon as you can determine these two values, you will need to add them together and then subtract them from 1 since 1 is the total area of the standard normal distribution.
Looking to know more about the F statistic?
How To Use The Z Score Table For Normal Distribution
One of the best things about using a z table is that it is pretty easy and straightforward. After all, when you are using a z table to discover the probabilities for a statistical sample with a normal distribution, then you just need to follow the next steps:
Step #1: Go to the row that represents the ones digit and the first digit after the decimal point (the tenths digit) of your z-value.
Step #2: Go to the column that represents the second digit after the decimal point (the hundredths digit) of your z-value.
Step #3: Intersect the row and column from Steps 1 and 2.
Step #4: This result represents p(Z < z), the probability that the random variable Z is less than the value z (also known as the percentage of z-values that are less than the given z value ).
Discover more about the z table and its uses.
Here’s an example. Let’s say that you want to find the p(Z < 2.13). So, you will need to use the z table and find the row for the decimal 2.1 and then the column for the 0.03. As soon as you intersect this row with this column, you will get your probability: 0.9834. Therefore p(Z < 2.13) = 0.9834.
If you remember, the total area under any normal curve (including the standardized normal curve) is 1. So, we can then state that:
p(Z < 2.13) + p(Z > 2.13) =1
Therefore:
p(Z > 2.13) = 1 – p(Z < 2.13)
p(Z > 2.13) = 1 – 0.9834
p(Z > 2.13) = 0.0166
Let’s now imagine that you are looking for the p(Z < –2.13) instead. In this case, you will need to find the row for the value of -2.1 and then the column for the value 0.03. As you intersect the row and the column, you find the number 0.0166. So, this means that:
p(Z < –2.13)=0.0166
However, if you take the time to observe, you will b able to see that you just got the same value as for p(Z > 2.13). This happens because we are dealing with a normal distribution which is always symmetrical. So the tail of the curve below –2.13 representing p(Z < –2.13) looks exactly like the tail above 2.13 representing p(Z > +2.13).