Category : F Test

T-Test And F-Test: Fundamentals Of Test Statistics

As you already know, statistics is all about coming up with models to explain what is going on in the world. 

But how good are we at that? After all, numbers are only good for so many things, right? How do we know if they are telling the right story? This is why you need to use test statistics. 
t-test-and-f-test

The main goal of a test statistic is to determine how well the model fits the data. Think of it a little like clothing. When you are in the store, the mannequin tells you how the clothes are supposed to look (the theoretical model). When you get home, you test them out and see how they actually look (the data-based model). The test-statistic tells you if the difference between them is significant.

Discover the best statistics calculators.

Simply put, test statistics calculate whether there is a significant difference between groups. Most often, test statistics are used to see if the model that you come up with is different from the ideal model of the population. For example, do the clothes look significantly different on the mannequin than they do on you? 

Let’s take a look at the two most common types of test statistics: t-test and F-test.

T-Test And Comparing Means
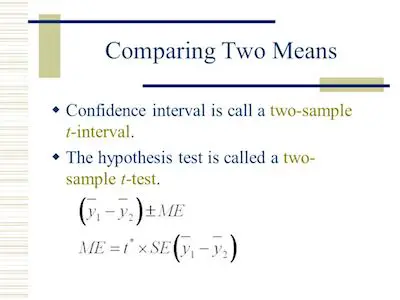
T-Test-And-Comparing-Means
The hypothesis test is called a two-sample t-test.

The t-test is a test statistic that compares the means of two different groups. There are a bunch of cases in which you may want to compare group performance such as test scores, clinical trials, or even how happy different types of people are in different places. As you can easily understand, different types of groups and setups call for different types of tests. The type of t-test that you may need depends on the type of sample that you have.

Understanding the basics of probability.

If your two groups are the same size and you are taking a sort of before-and-after experiment, then you will conduct what is called a dependent or Paired Sample t-test. If the two groups are different sizes or you are comparing two separate event means, then you conduct an Independent Sample t-test.

Overall speaking, a t-test is a form of statistical analysis that compares the measured mean to the population mean, or a baseline mean, in terms of standard deviation. Since we are dealing with the same group of people in a before-and-after kind of situation, you want to conduct a dependent t-test. You can think of the without scenario as a baseline to the with scenario.

F-Test Statistic
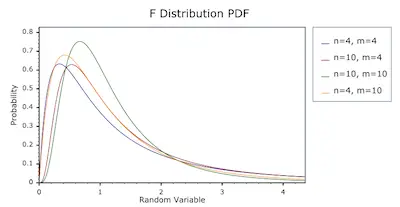
F-Test-Statistic

Sometimes, you want to compare a model that you have calculated to a mean. For example, let’s say that you have calculated a linear regression model. Remember that the mean is also a model that can be used to explain the data.

Learn the measures of position.

The F-Test is a way that you compare the model that you have calculated to the overall mean of the data. Similar to the t-test, if it is higher than a critical value then the model is better at explaining the data than the mean is.

Before we get into the nitty-gritty of the F-test, we need to talk about the sum of squares. Let’s take a look at an example of some data that already has a line of best fit on it.
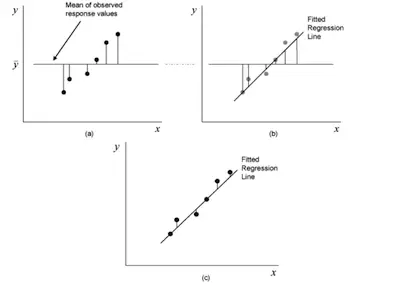
F-Test-Statistic-graphs

The F-test compares what is called the mean sum of squares for the residuals of the model and the overall mean of the data. Party fact, the residuals are the difference between the actual, or observed, data point and the predicted data point.

Understanding the measures of dispersion.

In the case of graph (a), you are looking at the residuals of the data points and the overall sample mean. In the case of graph (c), you are looking at the residuals of the data points and the model that you calculated from the data. But in graph (b), you are looking at the residuals of the model and the overall sample mean.

The sum of squares is a measure of how the residuals compare to the model or the mean, depending on which one we are working with. 

How To Interpret The F-Test Of Overall Significance In Regression Analysis

Simply put, the F-test of overall significance tells you whether your linear regression model is a better fit to the data than a model that contains no independent variables. So, today, we decided to take a step further and tale a look at how the F-test of overall significance fits in with other regression statistics, such as R-squared. 

Find all the statistics calculators you need here.

F-test

In case you don’t know or simply don’t remember, the R-squared tells you how well your model fits the data, and the F-test is related to it.

Understanding The F-Test

One of the things that statistics students need to keep in mind is that the F-test is a statistical test that is incredibly flexible. This means that you can actually use it in a wide range of settings. One of the main advantages of using the F-test is that it allows you to compare the fits of different linear models which is something that t-tests don’t do.

Check out our F-value calculator.

Calculating The F-Test Of Overall Significance

When you need to calculate the F-test of overall significance, you just need to use your statistical software and add the right terms in the 2 models that it compares. 

F-Test-Formula

Notice that the overall F-test compares the model that you specify to the model with no independent variables. This type of model is also known as an intercept-only model.

When you need to run the F-test for overall significance, it will have two hypotheses:

  • The null hypothesis states that the model with no independent variables fits the data as well as your model.
  • The alternative hypothesis says that your model fits the data better than the intercept-only model.

In statistical output, you can find the overall F-test in the ANOVA table. 


Understanding a bit more about the F test.

Interpreting The Overall F-Test Of Significance

F-Test-in-Excel

In order to interpret the results of the test, you will need to compare the p-value for the F-test to your significance level. In case the p-value is inferior to the significance level, this means that your sample data delivers enough evidence to conclude that your regression model fits the data better than the model with no independent variables. In case you are wondering, this is good news. After all, it means that the independent variables in your model improve the fit.

Overall speaking, when none of your independent variables are statistically significant, this means that the overall F-test is also not statistically significant. 

In some situations, tests may produce conflicting results. This can occur because the F-test of overall significance assesses all of the coefficients jointly whereas the t-test for each coefficient examines them individually. These conflicting test results can be hard to understand. 

Here’s an F-test example.

Additional Way To Interpret The F-Test Of Overall Significance

It is also important to keep in mind that when you have a statistically significant overall F-test, you can also draw other conclusions. 

When you have a model with no independent variables, for example, you can easily conclude that all of the model’s predictions equal the mean of the dependent variable. Therefore, if the overall F-test is statistically significant, your model’s predictions are an improvement over using the mean.


Understanding The F Test

Simply put, an F test is a kind of catch-all term for any tests that you make that use the F-distribution. In most cases, when someone is talking about an F test, they are simply talking about the F-test to compare two variances. Nevertheless, you must understand that the F-statistic is used in many different tests including the Scheffe Test, the Chow test, and even regression analysis. 

Discover all the statistic calculators you can use for free. 

Following The Steps To Do An F Test

F-test-1

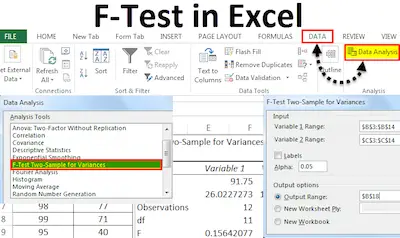
In case you want to run an F test, you need to know that doing it by hand can become a bit tedious and slow. So, instead, you can use some technology to run it such as Minitab, SPSS or even Excel. 

While some of the steps that we are about to show you are immediately done by technology, it is important that you know exactly what you are doing when you are running an F test. 

Step #1: The first thing that you always need to do when you are running a test is to define your hypothesis. So, you will need to state both the null hypothesis as well as the alternative hypothesis.

F-Test-Formula

Discover how to determine the critical F value.

Step #2: The next thing that you need to do is to calculate the F value. To do so, you will need to use the following formula:

F = (SSE1 – SSE2 / m) / SSE2 / n-k

where,

SSE = the residual sum of squares

m = the number of restrictions

k = the number of independent variables.  

Use our calculator to determine the F critical value easily.

Step #3: As soon as you determine the F value, you will need to find the F statistic which is the critical value for this test. To determine the F statistic value, you can simply use the following formula:

F Statistic = variance of the group means / mean of the within-group variances

So, you can find the F statistic in the F-table. 

Step #4: This is the step where you can finally conclude if you support or reject the null hypothesis. 

F Test T Compare Two Variances

statistics

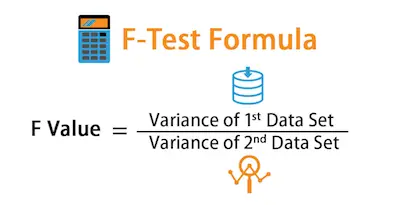
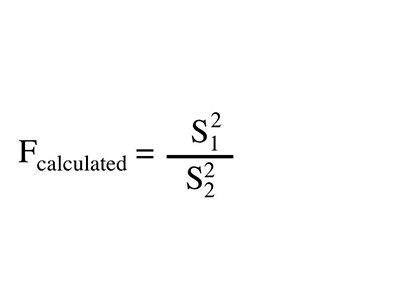
As we already mentioned above, the statistical F test can use an F statistic to compare two variances. This is done by dividing them (s1 / s2). One of the things that you need to know is that this result is always positive. 

The formula used is: 

F = s21 / s22

In case the variances are equal, this means that the ration of the variances just displayed above is equal to 1. 

One detail that you should always remember is that in this test, you will always be testing that the population variances are equal. So, we can also say that you always need to assume that the variances are equal to 1. So, and following what we already know, your null hypothesis will always be that the variances are equal. 

Looking for a free calculator to determine the F critical value?

Assumptions

F-calculated-formula

Some of the assumptions that are made for the test include:

– The larger variance that you have should always go in the numerator so that you can get a right-tailed test that us easier to calculate.

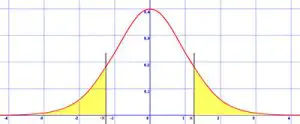
– In case you have two-tailed tests, you will need to divide alpha by 2 before you even determine the right critical value.

– In case you only have the standard deviations, you will need to square them to get the respective variances. 

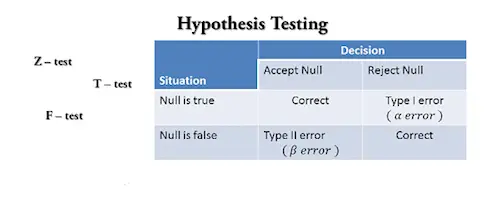
– In case your degrees of freedom aren’t listed in the F table, you will need to use the larger critical value to avoid any Type I errors. 


A Better Understanding About The F Statistic

When you are learning statistics, you will need to understand what the F Statistics is and what it is used for. So, let’s get started with the F Statistics definition.

What Is The F Statistic?

F-statistic

Simply put, the F statistic is the value that you get when you do a regression analysis or you run the ANOVA test to try to find out if the mean between two populations ate significantly different. 

Discover everything you need to know about statistics.

The truth is that the F statistic is very similar to the T statistic. After all, while the T test will allow you to know if a single variable is statistically significant, the F test will allow you to determine if a group of variables is jointly significant. 

What Is “Statistically Significant”?

Statistically-Significant

One of the questions that we keep getting, especially from statistics students, is about what means to be statistically significant. In case you also have the same question, let us clear that for you.

Simply put, when you have a significant result, this means that your results likely didn’t happen by chance. On the other hand, when you don’t have a statistically significant result, this means that you can’t get to a real result. So, this means that you can’t reject the null hypothesis. 

Use our calculator to determine the critical F value.

Using The F Statistic

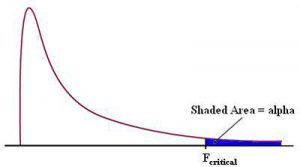
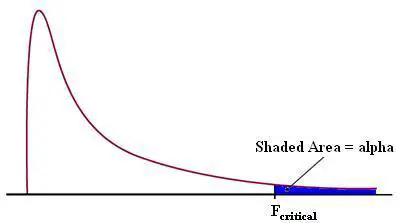
When you are looking to either support or reject the null hypothesis, you need to determine the F statistics. One of the things that you need to know is that in your F test results, you will have an F critical value and an F value. 

Notice that the F critical value is also known as the F statistic and that the value that you determine from your data is called F value. 

learning-statistics

Looking to calculate the critical F value?

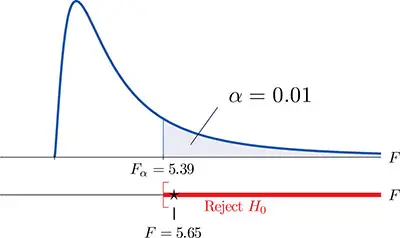
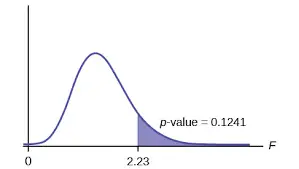
Overall speaking, when your F value in a test is larger than your F statistic, this means that you can reject the null hypothesis. However, you need to keep in mind that the statistic is only one measure of significance in an F test. This means that you also need to determine the p value. Simply put, the p value is determined by the F statistic and is the probability that your results may have happened by chance. 

The F Statistic And The P Value

As we have just shown you, it is very frequent to use the p value combined with the F statistic when you are trying to determine if your results are significant. This is because if you have a significant result, it just doesn’t mean that all your variables are significant. The reality is that the statistic is simply comparing the joint effect of all the variables together. 

F-test

Discover how to easily determine your F critical value.

Let’s say that you are using the F statistic in regression analysis. This may occur because there was a change in the coefficient of determination or a change in the R squared. So, in this case, you will need to use the p value to get the “big picture”. 

In case you get a p value that is less than the alpha value, which is usually considered 0.05, you should proceed with the test. On the other hand, when the p value is more than 0.05, this means that your results aren’t significant and therefore, you can’t reject the null hypothesis. 

Ultimately, you will need to study the individual p values to determine which ones of the variables you are studying are statistically significant. 


F Test Example – A More Practical Insight

If you are studying statistics at school, you probably already heard about the F test. But what is the F test exactly?

Simply put, the F test is a general name that is given to all the tests that need to use the F-distribution. So, when you hear someone talking about the F test, they are probably referring to the F test that serves to compare two variances. Nevertheless, the F test can be used in a wide variety of tests.

Check the best online stat tables. 

f-test-example

While you may have some questions about the F test and how to determine its value, we believe that before we show you an f test example, we should define the F test better.

When Should You Use An F Test?

There are two different occasions on which you should an F test. These include:

– When you need to compare the variability of a new method versus an old method

– When you want to compare the two different variances that you got when you used a t test.

F Test Assumptions

There are a couple of assumptions that you need to know about when you want to perform an F test. The truth is that in order to perform this kind of test, you need to ensure that the population is approximately normally distributed.


F-test-normal-distribution

In addition, you also need to ensure that the samples are independent events. Besides all this, you also need to bear in mind that:

– In case you are given standard deviations to make the calculations, you need to square them in order to get the variances,

– The larger variance should always be in the numerator so that the result is a positive one. This ensures that the calculations are easier to make.

– In case the degrees of freedom you need aren’t listed in the F table, you should use the critical value that is larger to avoid any errors.

– In case you are performing two-tailed tests, you need to ensure that you divide alpha by 2 before you calculate the right critical value.

F Test Example:

Now that you already know the assumptions and the factors that you need to keep in mind when you need to do an f test, it’s time to show you a practical f test example.

In this F test example, we will be comparing two variances by hand.

Step #1: If you were given standard deviations, you need to ensure that you square them to get the respective variances.

So, let’s say that you have the following standard deviations:

σ1 = 9.6

σ2 = 10.9


F-critical-value

In order to know the variances (s1 and s2), you will need to:

s1 = 9.6^2 = 92.16

s2 = 10.9^2 = 118.81

Use our critical F value calculator to confirm your results.

Step #2: Now, it’s time to divide the variances to get the F value. As we already told you, you need to use the higher variance number on the numerator and divide it by the smallest variance.

So, supposing that you have:

s1 = 2.5

s2 = 9.4

F = s2 / s1 = 9.4 / 2.5 = 3.76

Step #3: In this step, you will find the degrees of freedom. In case you don’t know, the degrees of freedom is equal to the size of your sample minus 1. Since we have two samples (variance 1 and variance 2), this means that you have two degrees of freedom – one for the numerator and the other one for the denominator.

Take a look at our Confidence Interval Calculator for the Population Mean.

Step #4: It’s now time to take a look at the F table and look for the F value that you calculated.

Step #5: Finally, it’s time to withdraw conclusions from our F test example. In this step, you will need to compare the value that you calculated on step 2 ( F = 3.76 ) with the table F value that you discovered in the previous step.

If the table F value is smaller than the value you calculated, then you can say that you reject the null hypothesis.