How To Find A Confidence Interval
When you are learning statistics, it’s common to hear about a confidence interval. But what exactly is a confidence interval?
Simply put, a confidence interval is a way that you have to know about how much uncertainty there is with any specific statistic. One of the things that you need to keep in mind is that a confidence interval is usually used with a margin of error.
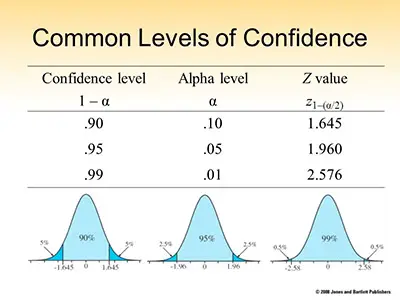
Take a look at the different statistical tables that you can use in statistics.
Overall, a confidence interval tells you how confident you can be about the results from a survey or from a poll to reflect what you expect to find if it was possible to do it for the entire population.
Confidence Intervals Vs. Confidence Levels
One of the things that you need to know is that a confidence interval is directly related to a confidence level.
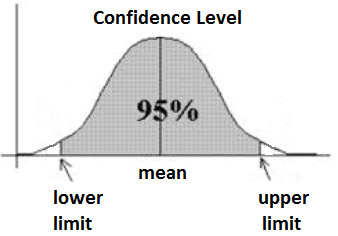
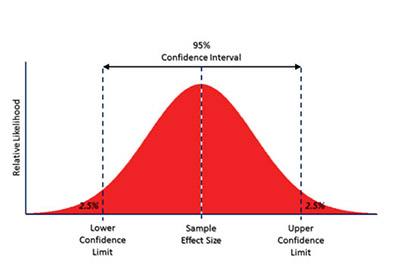
A confidence level is usually expressed in terms of a percentage. Most of the times, you will see polls and surveys stating that they used a confidence level of 95%. This means that in case you repeat the exact same survey or poll over and over again, 95% of the time your results will match the results you get from a population. On the other hand, a confidence interval is a result that you get. Ley’s say that you made a quick survey to a small group f pet owners to see how much cans of dog foods they purchase a year.
If you test your statistics at the 99% confidence level and if you get a confidence interval of (200,300), this means that you believe that these owners will buy between 200 to 300 cans of dog food each year. Besides, you are incredibly confident that this will occur – 99%.
Learn more about how to conduct a t test in excel.
Applying Confidence Intervals To Real Life Examples
The United States Census Bureau usually uses confidence levels of 90% in most of the surveys they do. Back in 1995, they did a survey about the number of people in poverty and they stated that they were using a 90% confidence level. According to them “The number of people in poverty in the United States is 35,534,124 to 37,315,094.”
Check out this paired t test example.
But what does this mean exactly?
Simply put, this means that if the United States Census Bureau was about to repeat this same survey over and over again using the same techniques is that 90% of the time, the results would always be between 35,534,124 and 37,315,094 people in poverty. So, we can say that the (35,534,124 to 37,315,094) is the confidence interval.
Confidence Interval – A Simple Example
Let’s say that you have a group of 10 patients who need foot surgery who have a mean weight of 240 pounds. You also know that the sample standard deviation was 25 pounds and that you need to find the confidence interval for a sample to ensure the right mean weight of al foot surgery patients. Consider a 95% confidence interval.

Discover how you can do an unpaired t test for two samples.
In order to solve this problem, you need to follow the next steps:
Step #1: Determine The Degrees Of Freedom
Take your sample size and subtract one. So, you will get:
10 – 1 = 9
Step #2: Subtract the confidence level from 1, and then divide by 2:
(1 – .95) / 2 = .025
Step #3: Now, you need to look at the answers that you got in both steps 1 and 2 and search for them in the t-distribution table.
Since you had 9 degrees of freedom and an α = 0.025, your result is 2.262.
Step #4: Now, it is time to divide your sample standard deviation by the square root of your sample size:
25 / √(10) = 7.90569415
Step 5: And now you need to multiply the result you got on step 3 and the result you got on step 4:
2.262 × 7.90569415 = 17.8826802
Step 6: Now, you need to determine both the lower and the upper end of the range:
– The lower end of the range:
240 – 17.8826802 = 222.117
– The upper end of the range:
240 + 17.8826802 = 257.883
And you just discovered the confidence interval.