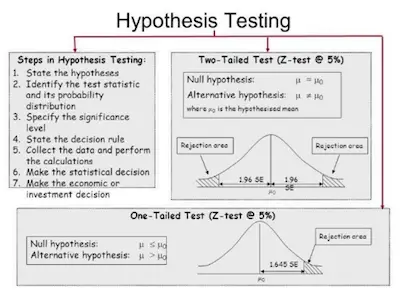
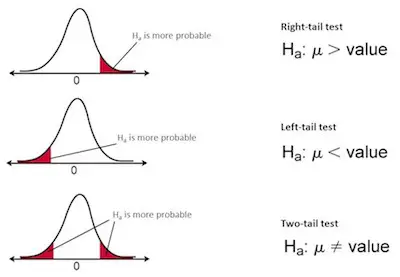
When you are conducting statistical analysis, you just can’t go through it without hypothesis testing.
Learn everything you need about statistics here.

Simply put, hypothesis testing refers to the process where you generate a clear and testable question, collect and analyze appropriate data, and finally draw an inference that answers your question. So, as you can see, there are many different steps you need to go through.
What Is A Hypothesis?
Overall speaking, a hypothesis is just a possible explanation you may have for patterns that you observe in people or nature. Let’s sat that you spent some time watching people drink coffee and you believe that most people drink more coffee in the morning than in the afternoon. So, when you watch this and you make this statement, you are stating that there is a difference between drinking coffee in the morning and afternoon.
Check out our student t value calculator.
On most occasions, you usually generate a hypothesis from previous research. Besides, it is important to keep in mind that a good hypothesis will propose a relationship between 2 or more variables.

Let’s get back to the previous coffee example.
What you are proposing here is that the time of the day actually affects the amount of coffee people drink. So, in this particular case, time of day is one variable and the number of coffees drank is another variable. Since you believe that the time of the day is the reason for people to drink more or less coffee, then you can assume that the time of day is the independent variable and the amount of coffee is the dependent variable.
Looking for a z-score calculator?
As soon as you have a clear hypothesis, you can then data so you can look at the pattern you predict. In this case, you would need to collect data on people both in the mornings and afternoons as well as how much coffee they drink at both times.

Now that you already collected your data, it is time to analyze it for patterns. In case you see the pattern that you predicted with your hypothesis, then you’re hypothesis was correct. However, you need to be able to state why. On the other hand, if your data doesn’t show the pattern you predicted, then you state that and revise your hypothesis to reflect the pattern in the data.
Easily determine the critical f-value using our simple calculator.
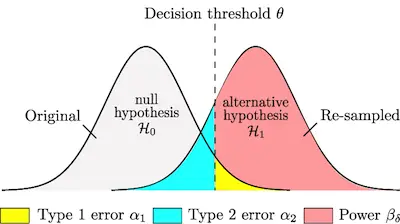
When you are doing hypothesis testing, one of the trickiest parts is determining whether the pattern or model that you find is not only different but different enough to mean something. And this is where the null hypothesis comes in.
Simply put, a null hypothesis (µ0) is a hypothesis that predicts no difference or pattern between the variables. In our example, the null hypothesis would be that there is no pattern between people drinking coffee and the time of day. If our hypothesis is not right, then the null hypothesis is right, and vice versa.
To determine if the statistical model that you come up with is different enough, we compare it to another sample or the population. In the case of the tired coffee drinkers, we would compare the average number of coffee drinks in the morning to the average number of coffee drinks in the afternoon.