Category : Median

Measures Of Central Tendency: Advantages & Disadvantages

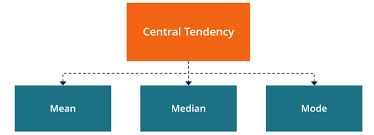
One of the first things that you learn in statistics is the measures of central tendency. These include the mean, the median, the mode, and the range. However, the first three are the most important ones and these are the ones that we will be looking at today. 

measures of central tendency

In case you don’t know or if you simply don’t remember, central tendency can be defined as the statistical measure that identifies a value that is capable of representing the entire distribution. 

Learn everything you need to know about statistics.

The main goal of using measures of central tendency is to get an accurate description of the entire data. After all, when you calculate the mean, median or mode, you are looking at a value that represents the entire data. 

#1: The Mean:

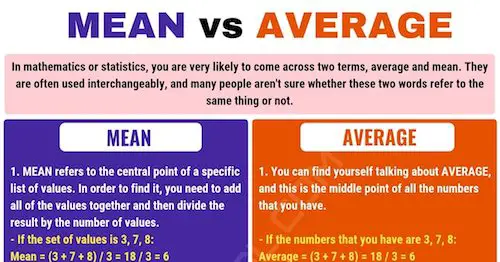
The mean can be defined in mathematical terms. After all, it is the average of all the terms. When you want to calculate the mean, you need to sum up all the values of all the terms and then divide by the number of terms. 

Advantages: 

  • You use all the available data
  • It’s a good option for ordinal or interval sets of data.

Disadvantages:

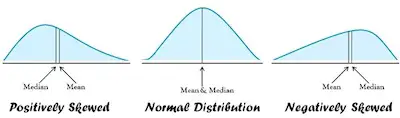
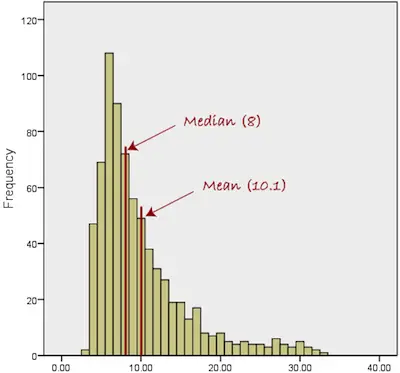
  • When the set of values that you have has an extreme value, then the mean isn’t representative. For example, when you have 4 6 9 2 4 59.

Click here to use our mean, median, mode, range calculator.

#2: The Mode:

The Mode

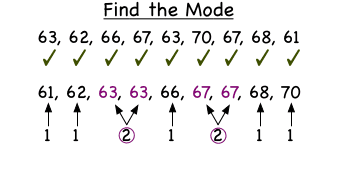
The mode can be described as the value of the term that occurs the most often. The truth is that it’s not uncommon at all for a distribution to include more than one mode, especially when there aren’t many terms. This occurs when two or more terms occur with equal frequency, and more often than any of the others.

Don’t know how to calculate mode?

Advantages:

  • The mode is always a value that is actually in the set of numbers. For example, in the sequence 3 6 3 11 4 3, the mode is 3. In case you would want to calculate the mean, then this sequence has a mean of 5 which is not actually a part of the sequence. 
  • This is the only measure of central tendency that is useful for nominal data. 

Disadvantages:

  • There are occasions where you can have more than one mode which makes the data less reliable. 

#3: The Median: 

The Median

One of the most important things to keep in mind about the median is that it needs to be calculated differently when you have a set of values that are odd or even. 

When you have an odd number of terms, then the median is the value of the term that is in the middle. On the other hand, when you have an even number of terms, then the median is the average of the two terms in the middle. 

Confirm if you calculated the median the right way with our free calculator.

Notice that when you want to calculate the median, you will need to order the values from the smallest to the largest. 

Advantages: 

  • Good to use with ordinal data.
  • Anomalies and extreme values don’t tend to affect it.

Disadvantages:

  • Doesn’t work well with small sets of data. 

Understanding The Mean And Median

There’s no question that the mean and median are two different measures that are widely used in statistics. After all, they are very effective when you want to describe the most typical value in a set of values. Notice that both mean and median are measures of central tendency. 

Use the best online statistics calculators.

The Mean And Median

As you can imagine, the mean and the median are two different concepts. And we believe that the best way to understand them is by showing an example. 

Let’s say that you draw a sample of 5 teenage boys and you measure their weights. You discover that they weight100 pounds, 100 pounds, 130 pounds, 140 pounds, and 150 pounds.

Now, you are asked to calculate both the mean and median. 

To calculate the mean of the sample, you will need to add all the observations and then divide them by the number of observations. So, in this specific example:

Mean = 100 + 100 + 130 + 140 + 150) / 5 

Mean = 620/5

Mean = 124 pounds

Click here to calculate the mean.

To calculate the median, you will need to arrange your data in order from the smallest to the largest value. You will then need to see if your sample size id odd or even. In case you have an odd number of observations, then the median is just the middle value. On the other hand, if you have an even number of observations, then the median is the average of the two middle values. So, in this specific example:

100 100 130 140 150

Since we have an odd number of observations (5), then the median is the middle value, 130 pounds. 

Click here to calculate the median.

Mean Vs Median

mean-vs-median

One of the things that many students wonder is about the importance of each one of these measures of central tendency. However, it’s important to look at both the mean and median as measures that have advantages and disadvantages and not in terms of importance. 

The median, for example, can be a better indicator of the most typical value if a set of scores has an extreme value that differs greatly from other values. On the other hand, it is also important to notice that when you have a very large sample size that doesn’t include these extreme values, then the mean is a better measure of central tendency. 

Check out our mean, media, mode, range calculator. 

But here’s a simple example so that you can fully understand these concepts and their advantages and disadvantages. 

Let’s say that you are looking at a sample of 10 households to estimate the family’s income. According to the data you collected, nine of the households have incomes between $20,000 and $100,000 but the tenth household has an annual income of $1,000,000,000. 

As you can see, the tenth household is an extreme value. So, if you want to use a measure of central tendency, then you should consider using the median. After all, if you use the mean instead, you will get an over-estimated value because of this tenth household. 

Bottom Line

As you can see, both the mean and median are important when you are analyzing data. However, using one or the other may be better depending on the samples that you need to analyze.