Category : Probability

Probability Distribution

A Comprehensive Exploration with Detailed Examples

Life is a series of unpredictable events, each carrying its own set of probabilities. Whether you’re contemplating the likelihood of rain affecting your weekend plans or analyzing the outcomes of a card game, you’re unknowingly navigating the waters of probability. One concept that reigns supreme in this realm is the ‘probability distribution.’ In this comprehensive exploration, we’ll demystify this cornerstone of statistics, amplifying our understanding through in-depth examples.

probability distribution

Check Out Our T-Statistic and Degrees of Freedom Calculator

Demystifying Probability Distribution

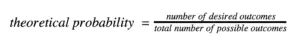
When we discuss probability distribution, we’re essentially referring to a mathematical function that gives the probabilities of occurrence of different outcomes for an experiment. In simpler terms, it’s a blueprint that lays out the likelihood of each potential outcome of a random process. It ensures that the combined probabilities of all these outcomes total to 1, offering a holistic view of all possibilities.

Broad Categories of Probability Distributions

Probability distributions don’t adhere to a one-size-fits-all model. Depending on the nature of outcomes, they can be primarily bucketed into:

  • Discrete Probability Distribution: Relevant for scenarios with distinct, separate, countable outcomes. Think of individual outcomes, like the faces of a dice.
  • Continuous Probability Distribution: Applicable for scenarios with a range of outcomes, where results can lie anywhere within a given continuum. Measures such as the weight or height of individuals typically fall here.

Diving into the Heart of Examples

Discrete Probability Distribution: Rolling a Dice

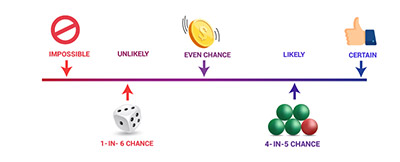
Let’s take the quintessential example of rolling a standard six-sided dice. Each face, from 1 to 6, has an identical probability of landing face-up. This probability stands at 1/6 or roughly 16.67%. In the realm of discrete distribution, the probability breakdown would look like:

– P(1) = 1/6

– P(2) = 1/6

– … and the pattern continues for each face.

Should you decide to graphically represent this, you’d notice each outcome shares an equal height, highlighting the essence of a uniform distribution.

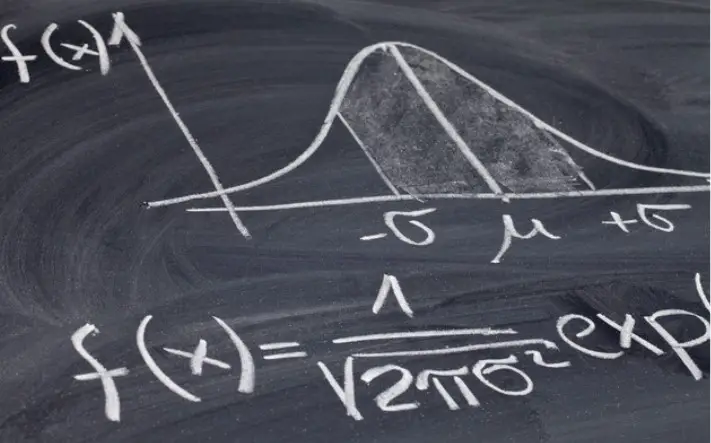
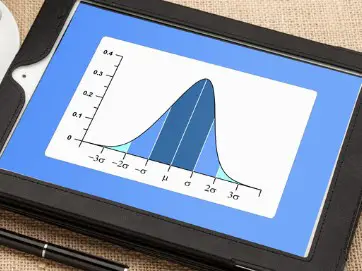
Continuous Probability Distribution: Evaluating Adult Heights

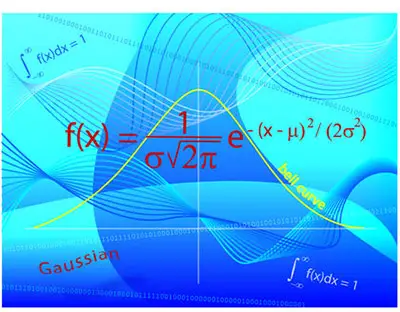
Venture into a thought experiment where you’re measuring the height of all adult females in a vast city. Given the intricacies of human genetics and environmental factors, it’s improbable for a large number to share the exact height down to the millimeter. This scenario is tailor-made for a continuous probability distribution. You might end up with a graph resembling a bell curve, a representation of the renowned normal distribution. In such instances, pinpointing the probability of a precise height (let’s say, 167.54 cm) would be zero. However, evaluating the likelihood within a specific range (like between 160 cm and 170 cm) offers a non-zero probability.

Spotlight on Renowned Probability Distributions

Several probability distributions have carved out their niche, owing to their paramount importance in various applications:

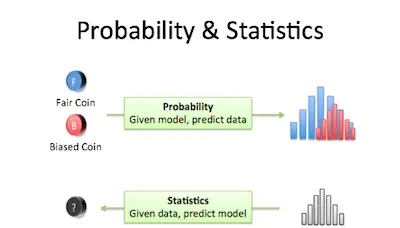
  • Binomial Distribution: This examines the number of successes across a fixed set of Bernoulli trials. Imagine assessing the odds of flipping 4 tails in 7 coin tosses.
  • Poisson Distribution: This is the go-to when modeling the frequency of events within specific intervals. An example could be gauging the number of customer service calls a company receives in an hour.
  • Normal Distribution: The iconic bell curve, where data clusters around the average. A classic example is how human IQ scores across a large population distribute.
probability distribution

Try Out Various Statistical Calculators

The Pervading Relevance of Probability Distributions

Far from being merely theoretical constructs, probability distributions are entrenched in diverse fields:

  • Finance: Stock market aficionados rely on them for pricing options and evaluating market volatilities.
  • Scientific Endeavors: Whether it’s astronomy or zoology, researchers harness distributions to decipher patterns and predict occurrences.
  • Corporate Realm: Enterprises tap into these distributions for sales forecasts, demand estimations, and other pivotal metrics.

Summary

Probability distributions are more than just mathematical concepts; they’re potent tools that offer lenses to decode the randomness enveloping our world. By grasping their intricacies, we arm ourselves with the ability to make nuanced predictions, deduce hidden patterns, and ultimately, craft informed strategies. From the simple toss of a coin to the complexities of global market trends, the footprints of probability distributions are omnipresent, asserting their undeniable significance.


Introduction To Probability And Statistics

There’s no question that probability and statistics are related. Ultimately they can both deliver the answers to questions such as:

probability-and-statistics
  • How likely are you to flip a coin and it lands on its edge? 
  • How likely is that you wear a blue shirt today? 

Among others. 

Discover the best stats calculators.

Probability

Probability

Simply put, the probability is the likelihood of something happening. This “something” is called an event. 

For example, let’s say that you’re playing Dungeons & Dragons. When you roll a D20, getting a 20 is a very good thing most of the time. However, everyone says that this is extremely rare. Yet, in reality, it is just as likely to roll a 20 as a 1. Let’s figure out why. 

Complete overview of the most common probability math problems.

When you are trying to figure out probability (P), you are trying to figure out the chance of an event occurring. The probability of an event occurring is usually written as P(event). 

In the case of our D&D dice when you roll it you have these outcomes

S = {1, 2, 3, 4, 5, 6, 7, 8, 9, 10, 11, 12, 13, 14, 15, 16, 17, 18, 19, 20}

This means that the likelihood of rolling a number 1 – 20 is 100% while the likelihood of rolling a 21 is 0%. But the events in between are a little different.

Probability is calculated as the total number of desired outcomes ÷ total number of possible outcomes.

Getting Back At Our Example

As we already mentioned above, there are 20 total possible events that can occur on a single roll of a fair D20. 

At this time, we are only interested in one of them, 20. Since it is one of 20 possible outcomes: 

P(20) = 1/20 = 0.05. 

We also already mentioned that it has the same likelihood of a 1 being rolled: 

P(1) = 1/20 = 0.05.

Now, rolling a number less than twenty is different. This would be:

P(1, 2, 3, 4, 5, 6, 7, 8, 9, 10, 11, 12, 13, 14, 15, 16, 17, 18, 19) = 19/20 = 0.95 

As you can see, it is much more likely. 

Summing up, rolling a D20 and getting a 20 is just as likely as rolling a 1. However, the reason 20s are so rare is that you are much more likely to roll a number less than 20. 

What is the probability theory?

Statistics

Statistics

As you already know, statistics is the application of the laws of probability to real, actual data. 

If you take the D20 example, this would be when you roll the dice 20 times and collect some data.

When you apply probability to real data, you are trying to determine if the outcome is significantly different from a model that you are generating. 

For example, the P(20) = 0.05, so let’s explore that.

Check out our binomial probability calculator.

When you collect data, there are several ways to describe the data that you take. The most common are mean, median, and mode. In the case of statistics, we want to see if our actual data conforms to the model. There are two ways to do this:

#1: Classical Inference:

Classical inference deals with data that have a fixed probability based on the number of cases and events.

 #2: Bayesian inference:

Bayesian inference deals with data whose probability is not fixed. That is, the probability is subject to change based on other factors. 


The Basics Of Probability

Generally speaking, when we talk about probability, we are referring to the likelihood that a certain event will occur. 

Discover the best statistics calculators in 2020.

One of the things you need to know about probabilities is that they vary between 0 and 1 (or 0% and 100%). The closer the probability is to zero, the lesser the likelihood the event has of occurring. On the other hand, the closer a probability is to 1, the greater the likelihood the event will occur.

probability

The truth is that since you have some background in statistics, probabilities are not new to you. But even if you’re just starting in statistics, if you look at the weather report for the day and see that there’s a “90% chance of rain,” you know that you should probably bring an umbrella. However, a “10% chance of rain” might prompt you to leave the umbrella at home. 

So, where do these numbers come from? 

Check out our binomial probability calculator.

Basics Of Probability: Certain Events And Impossible Events

As you can easily understand, when an event has a probability of 1 or 100%, we can call it a certain event. For example, in a coin toss, the probability that the coin lands either heads or tails is 100%. These are the only possible outcomes, and it’s certain that one of them will occur.

On the other hand, an impossible event has a probability of 0 or 0%. An example would the probability of drawing five kings from a fair, standard deck of 52 cards. The reason this event is impossible is because there are only four kings in the deck.

Learn more about the probability theory.

Calculating Theoretical Probability

Imagine now that you have a bag and 8 colored marbles inside, all equal in size, and weight. 

Calculating-Theoretical-Probability

If you pick a random bag from the bag, what is the probability that it is the black marble? To determine this, you would need to use the following formula:

probability-formula

Notice that the desired outcome is what you want. In this example, it would b the black marble which means that you only have one desired outcome out of a total of 8 total possible outcomes (8 total marbles). 

Therefore the probability that you pick the black marble is ⅛, or 0.125, or 12.5%. We often write this as follows:

P(black) = ⅛

Check out this overview of the most common probability math problems. 

Probability And Sample Spaces

Let’s keep using the same example of the bag with 8 marbles inside. The bag and the marbles it contains can be considered a sample space. 

Technically speaking, a sample space contains all the values that a random variable can take. This means that it contains all the possible outcomes. So, getting back at our example, all of the outcomes are equally likely. 

Basics Of Probability: “Or”

When you are learning probabilities, it is fairly common that you need to work with the word “or”. For example, imagine that you want to find out the probability that you draw a black or a red marble from the bag. 

As you can easily understand, this increases your number of desired outcomes since you now may draw a black or a red marble. 

Since there is one black marble and two red marbles, the total number of desired outcomes is now three. Since the total number of possible outcomes is unchanged (the number of total marbles is constant), so:

P(black or red) = ⅜


The Monte Carlo Simulation

The Monte Carlo simulation, also known as the Monte Carlo Method or the Monte Carlo Sampling, is one of the many ways that you have at your disposal to determine the risk in quantitative analysis and in decision making. 

Monte-Carlo-Simulation

The Monte Carlo simulation is a method that allows you to determine all the possible outcomes of your decisions while, at the same time, it assesses the impacts of the risk. 

Discover the best probability calculators.

The Monte Carlo simulation uses intensive statistical sampling methods. Therefore and due to their complexity, they are, in most cases, only performed with the use of a computer. 

The Monte Carlo simulation is complex because: 

– The input model needs to be simulated hundreds or thousands of times and where each and every simulation needs to be equally likely. 

– The Monte Carlo simulation doesn’t only transform numbers from a random number generator as it also takes these sequences and makes then repeat after a certain number of samples. 

When you use the Monte Carlo simulation, you will be able to determine all the possible events that will or could happen as well as the probability of each possible outcome. 

What is normal distribution?

How Is The Monte Carlo Simulation Use In Real Life

Monte-Carlo-simulation-and-probability

Since the Monte Carlo simulation will deliver you a quantified probability, this means that it also delivers you scenarios with numbers that you can definitely use. 

Let’s say that you are looking to build a factory close to the wetlands and that you want to discover if it will affect the local bird life. In this case, a quantified probability could be something like if you build a new factory, there are about 60% chance that the bird population is affected. As you can see, this is a lot more precise than to simply state that the bird population will be affected. And this is what you get from the Monte Carlo simulation. 

Discover everything you need to know about the Probability Theory. 

Here are the different areas and industries where you can successfully use the Monte Carlo simulation:

– Estimating the transmission of particles through matter

– Assessing risk for credit or insurance

– Analyzing radiative heat transfer problems

odds-vs-probability

– Simulating proteins in biology

– Foreseeing where prices of securities are likely to move

– Calculating the probability of cost overruns in large projects

– Analyzing how a network or electric grid will perform in different scenarios.

Check out this ultimate guide to descriptive analysis.

The Monte Carlo Simulation Accuracy

When you are looking at probabilities, it is important that you use a method that is accurate. And this is exactly the case of The Monte Carlo Simulation. After all, there are many different factors that lead to ensure that The Monte Carlo Simulation is able to hit the exact mark. These include:

– Usually, there are several unknowns in the system

– It usually includes a lot of data

– Since we are determining a probability, there is always a margin of error related to the results that is accepted. 

The truth is that there are times when The Monte Carlo Simulation can drive you into a bad result. This may occur when:

probabilities

– the underlying risk factors aren’t complete 

-you are using an unrealistic probability distribution or when you are using an incorrect model

– the random number generator that you chose for the method isn’t good enough

– using the Monte Carlo simulation isn’t suited to your data

– there are computer bugs.


What Is The Probability Theory

The Probability Theory is one of the many branches of mathematics that concerns with the analysis of random phenomena. 

Probability-Theory

When a random event occurs, you don’t know the outcome. However, you know that there may be several outcomes. So, the Probability Theory helps you determine how likely it is for one of those outcomes to occur. 

The ultimate statistics website you need.

Applying The Probability Theory

One of the things that you need to know and understand about the Probability Theory is that when an experiment can be repeated under similar conditions, it can lead to different outcomes on different trials. 

The group of all the possible outcomes of an experiment is named “sample space”. Let’s say that you want to conduct an experiment tossing a coin. You know that you will have a sample space with two possible outcomes: heads and tails.  

Discover the most common probability math problems.

In case you decide to toss two dice, you know that you will have a sample space with 36 possible outcomes. Each one of these possible outcomes can be named an ordered pair (i, j), where both i and j can assume the values of 1, 2, 3, 4, 5, and 6. 

dices

When we are using the Probability Theory, it is important that both dice are different. They can have different colors, for example. This way, you know that the outcome (3, 1) is different from the outcome (1, 3). However, if you are trying to determine the probability of the event of the sum of the faces showing on the two dice equals six, you will have five different possible outcomes: (1, 5), (2, 4), (3, 3), (4, 2), and (5, 1).

But there are more examples where we can use the Probability Theory. On this one, we will use a drawing of n balls from an urn. This urn includes several balls of different colors. The reality is that this simple example allows providing a good guidance for many different events that may occur in real life. After all, we can use this example as a basis to better understand sample surveys or opinion polls. 

What is a statistical question?

Let’s say that you identify candidate 1 to an election with a ball of a specific color, candidate 2 is identified with a ball of a different color, and so on. So, according to the Probability Theory, you can learn about the electoral preferences of a specific population using simply a sample drawn from that same population. 

balls-in-urns

The Probability Theory, specifically this simple urn draw, is also used with clinical trials. These can be used to determine if a new surgery, a new drug or a new treatment for a disease is better than the standard treatment. 

Take a look at the basic statistic formulas that you need to understand.

tossing-a-coin

However, there are also other experiments that have infinite possible outcomes. Just think about when you want to toss a coin up until tails appear for the first time. This is the kind of experiment that can serve as the basis for measurements such as marginal income, reaction time, temperature, voltage, volume, among others. After all, these ate all made on continuous scales. So, if you keep measuring the different objects or the same object at different times, this can lead to different outcomes. So, we can say that the Probability Theory is also a powerful tool when you need to study this variability. 


An Overview Of The Most Common Probability Math Problems

While you may look at probability math problems and don’t see any practical examples of them in the real life, this isn’t quite true. The truth is that this is one of the areas of math where you can really apply it to the real life.

Answering questions about your chances to get into a specific college or university, for example, can be answered using probabilities.

Get the help you need with our free statistical calculators.

probability-math-problems

Before we show you some practical probability math problems, it’s important that you know that in math, probability is the likelihood of a certain event to occur. So, we can also say that we can have 3 possible solutions:

  • either the vent will happen for sure, meaning that the probability is 1;
  • the event won’t ever happen, meaning that the probability is 0;
  • the even may occur sometimes, meaning that the probability is between 0 and 1.

So, based on these assumptions, you can never have a negative probability value.

The basic formula of probability is as follows:

P(A)  = ( Number of ways A can occur ) / ( Total number of possible outcomes )

Example: Let’s say that you want to roll a die and you want to know the probability of rolling a 3.

You know that the number of ways it can occur is 1 and that there are 6 different possible outcomes. After all, you can roll the dice and get 1, 2, 3, 4, 5 or 6.

So, P = 1/6

Discover some basic statistics and probability formulas.

rolling-die

However, not all probability math problems are so simple. Most of the times, you want to discover the probability of the occurrence of more than one outcome. This is called the compound probability and its formula is as follows:

P(A or B) = P(A) + P(B) – P(A and B)

where,

  • both A and B are two different events.
  • P(A or B) refers to the probability of the occurrence of at least one of these events.
  • P(A and B) refers to the probability of the occurrence of both A and B at the same time.

In addition, you can also have mutually exclusive events. But what does this mean exactly?

Simply put, mutually exclusive events are the events where only one of them will occur. So, when you have mutually exclusive events, P(A and B) = 0.

Looking for more complicated probability math problems? Use out Binomial probability calculator.  [ https://statcalculators.com/binomial-probability-calculator/ ]

Example: Let’s say that you want to know the probability of rolling a 1 or a 4 when you roll a die.

If we were talking about individual probabilities, you would have the same probability for both events: P = 1/6. However, you want to discover the compound probability.

deck-of-cards

So, by using the formula:

P(2 or 5) = P(2) + P(5) – P(2 and 5) = 1/6 + 1/6 – 0 = 2/6 = 1/3

Independent And Dependent Events

In probabilities, you can have either independent events or dependent events.

#1: Independent Events:

You have an independent event when multiple events occur and the outcome of an event doesn’t affect the outcome of the other events.

#2: Dependent Events:

You have a dependent event when two events occur and the outcome of one of them affects the other.

While when you roll a die, you will always have independent events no matter the probability that you want to calculate, when you are playing with cards and you want to know the probability of getting a specific one, can either be an independent or a dependent event. This all depends on whether there is a replacement of the card to the deck or not.