What Is The Probability Theory
The Probability Theory is one of the many branches of mathematics that concerns with the analysis of random phenomena.
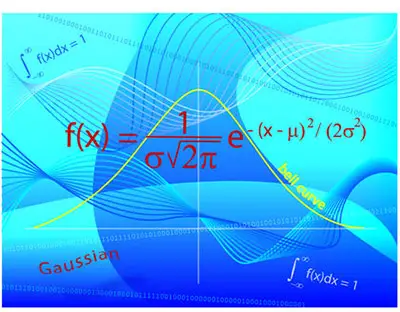
When a random event occurs, you don’t know the outcome. However, you know that there may be several outcomes. So, the Probability Theory helps you determine how likely it is for one of those outcomes to occur.
The ultimate statistics website you need.
Applying The Probability Theory
One of the things that you need to know and understand about the Probability Theory is that when an experiment can be repeated under similar conditions, it can lead to different outcomes on different trials.
The group of all the possible outcomes of an experiment is named “sample space”. Let’s say that you want to conduct an experiment tossing a coin. You know that you will have a sample space with two possible outcomes: heads and tails.
Discover the most common probability math problems.
In case you decide to toss two dice, you know that you will have a sample space with 36 possible outcomes. Each one of these possible outcomes can be named an ordered pair (i, j), where both i and j can assume the values of 1, 2, 3, 4, 5, and 6.

When we are using the Probability Theory, it is important that both dice are different. They can have different colors, for example. This way, you know that the outcome (3, 1) is different from the outcome (1, 3). However, if you are trying to determine the probability of the event of the sum of the faces showing on the two dice equals six, you will have five different possible outcomes: (1, 5), (2, 4), (3, 3), (4, 2), and (5, 1).
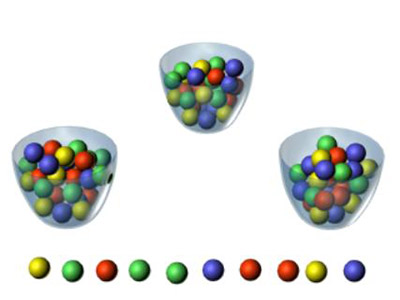
But there are more examples where we can use the Probability Theory. On this one, we will use a drawing of n balls from an urn. This urn includes several balls of different colors. The reality is that this simple example allows providing a good guidance for many different events that may occur in real life. After all, we can use this example as a basis to better understand sample surveys or opinion polls.
What is a statistical question?
Let’s say that you identify candidate 1 to an election with a ball of a specific color, candidate 2 is identified with a ball of a different color, and so on. So, according to the Probability Theory, you can learn about the electoral preferences of a specific population using simply a sample drawn from that same population.
The Probability Theory, specifically this simple urn draw, is also used with clinical trials. These can be used to determine if a new surgery, a new drug or a new treatment for a disease is better than the standard treatment.
Take a look at the basic statistic formulas that you need to understand.

However, there are also other experiments that have infinite possible outcomes. Just think about when you want to toss a coin up until tails appear for the first time. This is the kind of experiment that can serve as the basis for measurements such as marginal income, reaction time, temperature, voltage, volume, among others. After all, these ate all made on continuous scales. So, if you keep measuring the different objects or the same object at different times, this can lead to different outcomes. So, we can say that the Probability Theory is also a powerful tool when you need to study this variability.