One of the first concepts that you will learn when you are studying statistics is the Z test. But can you tell some Z test example problems?
Before we answer this question, it is important to remember what the Z test is and what it should be used for.
Looking for a statistical calculator?
Simply put, the Z test is a statistical procedure that allows you to test the different or alternate hypothesis against the null hypothesis. While the null hypothesis is the one that the researcher tries to reject and usually reflects the common view of the subject, the alternate hypothesis is what the researcher thinks is the cause of a certain phenomenon.
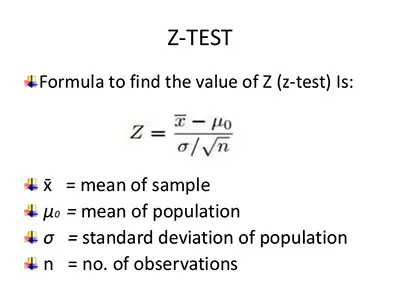
In order to solve any Z test example problems, you need to make use of the Z test formula:
One of the things that is always important to have in mind when you are considering doing a Z test is that you need to have a large sample. The truth is that since we are trying to prove the validity of the null hypothesis, you need to make sure that you have a good population size to have a complete view of the problem that you are trying to solve. The larger the sample of the population you get, the lower are the odds of getting a wrong conclusion.
Ultimately, you will use a Z test when:
- the samples are randomly drawn
- you know the standard deviation
- the number of observations is large
- the samples are taken from a population, independently.
Z Test Example Problems
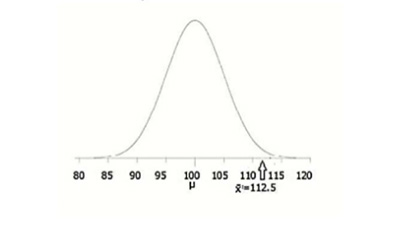
Let’s say that a teacher is convinced that his students have an IQ above average. So, he randomly picked 30 students and they have a mean score of 112.5. Is this enough to prove that the teacher is right?
Please notice that the mean population IQ is 100 and that the standard deviation is 15.
#1: Stating the different hypothesis:
– The Null Hypothesis: We accept the fact that the mean population IQ is 100. So,
H0: μ = 100
– The Alternate Hypothesis: We want to see of the students have an above average IQ. So,
H1: μ > 100
This is how you determine the standard deviation.
#2: Draw A Chart:
One of the things that can really help you solve a Z test problem is by drawing a picture to visualize your data:
#3: The Alpha-Level:
In this case, no one said anything about the alpha-level. So, when this happens, you need to assume that the alpha-level is 0.05.
So, in this case, you would have a Z-score = 1.645
Learn how to find the Z score for a normally distributed data.
#4: Using The Z-test Formula:

Z = (112.5 – 100) / (15 / √30 ) = 4.56
#5: Conclusions:
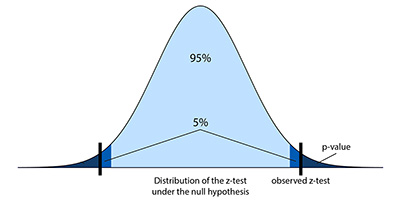
Since 4.56 is greater than 1.645, you will reject the null hypothesis, making the teacher’s claim right.
These are the basic statistic formulas that you need to know.
As you can see, making a Z test doesn’t need to b complicated at all. We understand that we showed you a simple example and that real-life problems can get a bit trickier. However, with experience and by understanding the Z-test basics, you will easily be able to solve any related problems.