Steps to Take When Your Regression Results Look Wrong
When you are doing statistical analysis, sometimes you stop wondering if your results can actually be correct. The truth is that while you took all the necessary steps and you are interpreting them, it seems that they just don’t make sense. No matter if you are thinking about the results using logic or theories, they just look wrong.

Discover all the stats calculators you need.
The truth is that the first feeling you tend to experience on these occasions is panic. However, there’s no need to feeling this way. In fact, while there are many possible causes of incorrect results, there are some steps that you can take that will help you discover what you did wrong and how you can correct it.
Steps to Take When Your Regression Results Look Wrong
#1: Errors In Data Coding And Entry:
One of the most common errors that you may commit when you are doing regressions is regarded with data coding and entry.
The truth is that you may forget to reverse code the negatively-worded items on a scale, for example. And while they may not be that important, you will see them when you place them in the wrong place if you look at bivariate graphs.
Check out our Z-score calculator.
#2: Misinterpretations:

One of the things that tend to happen frequently is that sometimes, your results aren’t wrong. You’re interpreting or reading them the wrong way.
Notice that while some misinterpretations come from software defaults, others come from the way the statistics are calculated. And on this kind of error, regression coefficients may be a bit tricky. After all, they change meaning depending on other terms in the model.
For example, with an interaction term in a regression model, coefficients of the component terms are not main effects, as they are without the interaction. So including an interaction can easily reverse or otherwise drastically change what looks like the same coefficient.
Looking for a binomial probability calculator?
#3: Misspecifying The Model:

Another common factor that may lead to regression results looking wrong is that you may not be using the best model for the data you have. So, in this case, your results may look wrong because they’re not accurate. Maybe you need to use a different type of model for your design and variables or there might be some effects that you didn’t include such as important control variables, non-linear effects, or interactions.
#4: Bigger Data Issues:

You already know that when you are doing statistical analysis you need to use high-quality data. However, you may have an issue with missing data and when you are using a software in multivariate analyses, this may lead to getting a lot of data getting dropped even if the percentage of missing data is small on any one variable.
Check out our student t-value calculator.
Steps to Take When Your Regression Results Look Wrong
So, how can you know what problem you are having?
The truth is that you just need to follow some steps in order to discover what you should do:
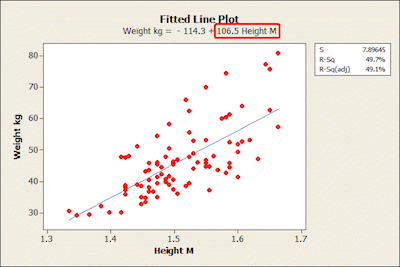
#1: Run univariate and bivariate descriptive statistics and graphs.
#2: Read output and syntax carefully.
#3: Check model assumptions and diagnose data issues like multicollinearity and missing data. Most model misspecifications will appear in model diagnostics.
Finally, consider the possibility that the unexpected result is correct. If you’ve gone through all the diagnoses thoroughly and you can be confident there aren’t any errors, accept the unexpected results. They’re often more interesting.