T-Test And F-Test: Fundamentals Of Test Statistics
As you already know, statistics is all about coming up with models to explain what is going on in the world.
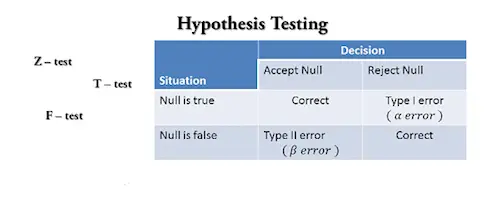
But how good are we at that? After all, numbers are only good for so many things, right? How do we know if they are telling the right story? This is why you need to use test statistics.

The main goal of a test statistic is to determine how well the model fits the data. Think of it a little like clothing. When you are in the store, the mannequin tells you how the clothes are supposed to look (the theoretical model). When you get home, you test them out and see how they actually look (the data-based model). The test-statistic tells you if the difference between them is significant.
Discover the best statistics calculators.
Simply put, test statistics calculate whether there is a significant difference between groups. Most often, test statistics are used to see if the model that you come up with is different from the ideal model of the population. For example, do the clothes look significantly different on the mannequin than they do on you?
Let’s take a look at the two most common types of test statistics: t-test and F-test.
T-Test And Comparing Means

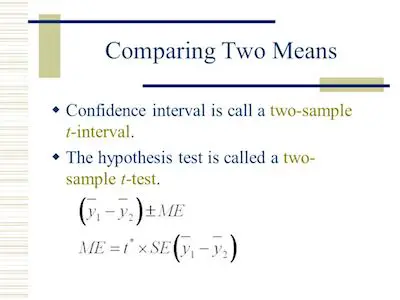
The t-test is a test statistic that compares the means of two different groups. There are a bunch of cases in which you may want to compare group performance such as test scores, clinical trials, or even how happy different types of people are in different places. As you can easily understand, different types of groups and setups call for different types of tests. The type of t-test that you may need depends on the type of sample that you have.
Understanding the basics of probability.
If your two groups are the same size and you are taking a sort of before-and-after experiment, then you will conduct what is called a dependent or Paired Sample t-test. If the two groups are different sizes or you are comparing two separate event means, then you conduct an Independent Sample t-test.
Overall speaking, a t-test is a form of statistical analysis that compares the measured mean to the population mean, or a baseline mean, in terms of standard deviation. Since we are dealing with the same group of people in a before-and-after kind of situation, you want to conduct a dependent t-test. You can think of the without scenario as a baseline to the with scenario.
F-Test Statistic

Sometimes, you want to compare a model that you have calculated to a mean. For example, let’s say that you have calculated a linear regression model. Remember that the mean is also a model that can be used to explain the data.
Learn the measures of position.
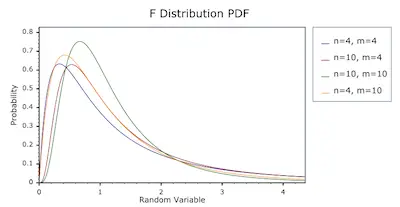
The F-Test is a way that you compare the model that you have calculated to the overall mean of the data. Similar to the t-test, if it is higher than a critical value then the model is better at explaining the data than the mean is.
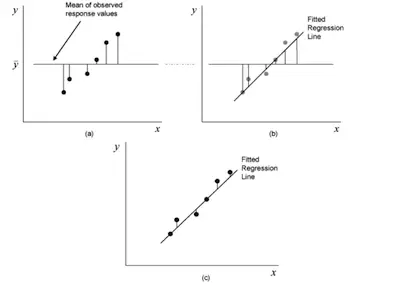
Before we get into the nitty-gritty of the F-test, we need to talk about the sum of squares. Let’s take a look at an example of some data that already has a line of best fit on it.

The F-test compares what is called the mean sum of squares for the residuals of the model and the overall mean of the data. Party fact, the residuals are the difference between the actual, or observed, data point and the predicted data point.
Understanding the measures of dispersion.
In the case of graph (a), you are looking at the residuals of the data points and the overall sample mean. In the case of graph (c), you are looking at the residuals of the data points and the model that you calculated from the data. But in graph (b), you are looking at the residuals of the model and the overall sample mean.
The sum of squares is a measure of how the residuals compare to the model or the mean, depending on which one we are working with.