Understanding The F Distribution
When you need to determine if the pattern you identify in your data is significantly different from no pattern at all, you can do this in many different ways. However, the one that is most common is using probability functions.
Discover all the calculators you need for statistics.
The truth is that probability functions allow you to determine the chance that your model is different. While there are also many probability functions, the F distribution is certainly the one that should be at the top of your list.
What Is The F Distribution?
Simply put, a probability distribution is a way that you have to determine the probability of a set of events occurring and this is true for the F distribution as well.
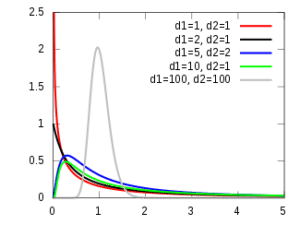
The F-distribution is a skewed distribution of probabilities similar to a chi-squared distribution. The main difference is that the F distribution deals with multiple levels of events having different degrees of freedom. This means that there are several versions of the F-distribution for differing levels of degrees of freedom.

Each curve you see above represents different degrees of freedom. So, this shows you that the area required for the test to be significant is different.
Make sure to use our critical F-value calculator.
When Should You Use The F Distribution?
The truth is that it’s quite unlikely that you need to build the actual curve by yourself since any statistical software can do it for you. Yet, you need to ensure that you use the curve concept in some experimental setups.
As you probably already know, the F-test, which uses the distribution, compares multiple levels of independent variables with multiple groups. This is what you can easily find in ANOVA and factorial ANOVA.
Imagine that you are testing a new drug called X and you want to determine the significant effects of different dosages. So, you decide to set trials of 0 mg, 50 mg, and 100 mg of X in three randomly selected groups of 30 each. This is a case for ANOVA, which uses the F distribution.
How To Use The F Distribution
As you probably already assumed, the F distribution is used for the F test. As you know, the F test involves calculating an F-score based on the variances of the 3 levels that you are testing compared to the sample size. The actual F-score is calculated using the following equation:

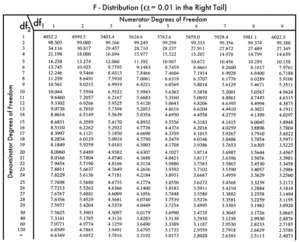
To determine if this value is high enough to be significant, you need to compare it to an F distribution table like this one:

You basically find the value at which your degrees of freedom intersect. If your calculated value is higher than the value in the table, then your samples are significantly different. If the calculated value is lower, then the groups are not different enough to be significant.
Learn how to perform a heteroskedasticity test.
Bottom Line
As you can see, the F distribution is a fairly simple concept that can be extremely useful in statistics. Now, you can easily determine the F score as well as use the F distribution table to withdraw your conclusions.