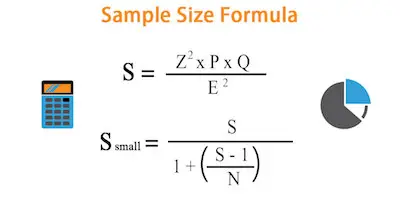
5 Steps For Calculating Sample Size
There’s no question that you need to keep many things in mind when you are looking to conduct a study or research. However, one of the most important factors to always consider is related to data especially data size.
In case you are wondering why this happens, it is fairly easy to understand. After all, undersized studies can’t find real results, and oversized studies find even insubstantial ones. We can then state that both undersized and oversized studies waste time, energy, and money; the former by using resources without finding results, and the latter by using more resources than necessary. Both expose an unnecessary number of participants to experimental risks.

Discover all the statistics calculators you need.
So, the trick is to size a study so that it is just large enough to detect an effect of scientific importance. If your effect turns out to be bigger, so much the better. But first, you need to gather some information about on which to base the estimates.
As soon as you’ve gathered that information, you can calculate by hand using a formula found in many textbooks, use one of many specialized software packages, or hand it over to a statistician, depending on the complexity of the analysis. But regardless of which way you or your statistician calculates it, you need to first do 5 steps.
Understanding the 2 problems with mean imputation when data is missing.
5 Steps For Calculating Sample Size

Step #1: Determine The Hypothesis Test:
The first step in calculating sample size is to determine the hypothesis test. While most studies have many hypotheses, in what concerns calculating sample size, you should only pick up to 3 main hypotheses. Make them explicit in terms of a null and alternative hypothesis.
Step #2: Specify The Significance Level Of The Test:
While the significance level assumed is, in most cases, 0.5, it doesn’t need to be.
Understanding measurement invariance and multiple group analysis.
Step #3: Determine The Smallest Effect Size That Is Of Scientific Interest:
For most, this is the most difficult aspect of what concerns calculating sample size. The truth is that the main goal isn’t to specify the effect size that you expect to find or that others have found, but to determine the smallest effect size of scientific interest. This means that you are looking for variables that actually affect the results or outcomes.
Here are some examples:
- If your therapy lowered anxiety by 3%, would it actually improve a patient’s life? How big would the drop have to be?
- If response times to the stimulus in the experimental condition were 40 ms faster than in the control condition, does that mean anything? Is a 40 ms difference meaningful? Is 20? 100?
- If 4 fewer beetles were found per plant with the treatment than with the control, would that really affect the plant? Can 4 more beetles destroy, or even stunt a plant, or does it require 10? 20?
Check out how cloud computing can benefit data science.
Step #4: Estimate The Values Of Other Parameters Necessary To Compute The Power Function:

If you have been studying statistics for some time, then you know that most statistical tests have the format of effect/standard error.
We’ve chosen a value for the effect in step #3. The standard error is generally the standard deviation/n. To solve for n, which is the point of all this, we need a value for standard deviation.
Step #5: Specify The Intended Power Of The Test:
The final step to calculating sample size is to specify the intended power of the test.
Simply put, the power of a test is just the probability of finding significance if the alternative hypothesis is true.
As you can understand, a power of 0.8 is the minimum. If it will be difficult to rerun the study or add a few more participants. On the other hand, a power of 0.9 is better. If you are applying for a grant, a power of 0.9 is always better.