Simply put, the ANOVA (or analysis of variance) can help you determine if the means of 3 or more groups are different. In order to do this, ANOVA uses the F tests to test if the means are equal or not.
Before we start with the ANOVA F value explanation, we need to ensure that you know everything that you need about the F statistic. The F statistic is simply the ratio of two variances. As you already know, variances are a mean of dispersion. So, this means that variances measure how far the data are scattered from the mean. Ultimately, the larger the values, the larger the dispersion you will have.
Use the statistic tables you need.

One of the things that you need to know about F tests is that they are very helpful and flexible. After all, you can use them in a wide variety of situations. You can use the F tests and the F statistics not only to test the equality of means but also to test specific regression terms, to compare the fits of different models, and even to test the overall significance for a regression model.
Why Using ANOVA F Value And Not A T Test?
When you have a lot of data, making a t test can be virtually impossible because they won’t provide you with accurate results. Just imagine that you want to make a t test for 4 different groups. So, you will end up with 8 pairwise comparisons. You need to compare group 1 with groups 2, 3, and 4. Then, you need to compare group 2 with groups 4 and 5, and so on. Even though you may think you have a 5% probability of a type I error, the truth is that you need to consider that you are dealing with 8 different pairwise comparisons. So, you just can’t expect them all to be significant.
If you need to calculate the t-statistic, use our T-Statistics and degrees of freedom calculator.
So, what can you do? The best chance that you have is to use the ANOVA F value.
Let’s imagine that you want to compare the heights of different children who have adopted a regular dit and other children who have adopted a vegan diet. So, now that the children are 13 years all, you decide to measure their heights.
The first thing that you need to think about is on the null hypothesis. With the ANOVA F value, the null hypothesis is that the means are all the same. So, μ1 = μ2 = μ3.
Learn how to calculate the standard deviation.
Now, it’s time to do the F test. In statistics, the F statistic formula is the following one:
F Statistics = variance between groups / variance within groups
In the case that it is proved that the null hypothesis is correct, these two variances should be very similar and you should end up with an F statistic value near 1.
Calculating Variance Within Groups
One of the questions that many people have is related to the way that you have to calculate the variance within groups. If this is also your case, the formula is very straightforward:
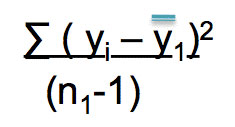
This calculation should be done for each one of the groups individually. However, you need to consider that not all groups are created the same way. So, you will need to weight these group variances using the degrees of freedom for each group. As you know, the degrees of freedom are equal to the total of the sample data minus 1.
So, you should get to a formula like the following one:

Calculating Variance Between Groups
In order to calculate the variance between groups, you need to use the following formula:
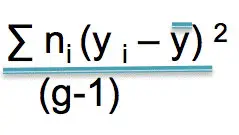
Here are the steps that you need to take:
#1: Subtract the mean of each group by the overall mean and square the result.
#2: Multiply the result you got by the number in each group.
#3: Add the result.
#4: Divide the result by the number of groups that you have minus 1.

