Category : Blog

Advantages And Pitfalls Of Using The Z Score

There’s no question that using the z score can be very helpful in certain situations. However, its use may also lead to pitfalls that you need to know about. However, before we start, we believe that it is important to remind you about what actually ar z scores.
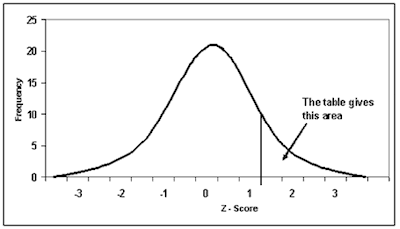
using the z score

Discover the best statistics calculators.

What Are Z Scores?

Simply put, z scores are a way that you have that allows you to standardize a score in respect to other scores in the group. As you already know, in order to determine the z score, you need to know both the mean and the standard deviation of the group. 
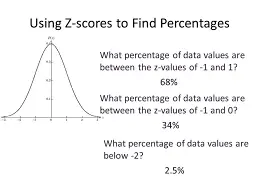
What Are Z Scores?

So, we can then state that a z score expresses a specific score in terms of how many standard deviations it is away from the mean. 

Looking to know more about the z score table?

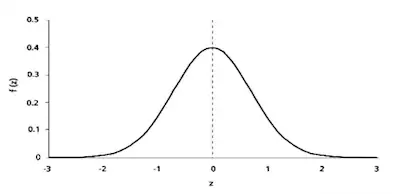
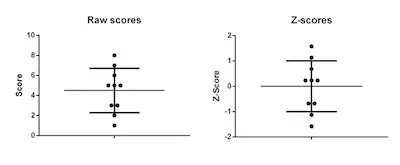
Notice that when you convert a raw score into a z score, you are ultimately expressing that score on a z score scale which always has a mean of zero and a standard deviation of one. So, to sum up, when you calculate the z score you are redefining each raw score in terms of how far away it is from the group mean. 

Now that you are already reminded about what a score is, it’s time to check out the advantages and pitfalls of using the z score. 

Advantages Of Using The Z Score
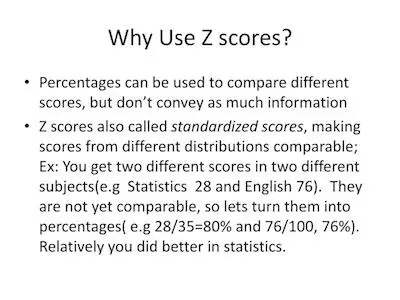
Advantages Of Using The Z Score

As you know, you can’t always use the z score. However, when it is possible, using it can bring different advantages:

#1: Clarity: 

One of the main advantages of using the z score is the fact that you can see and understand the relationship between the raw score and the distribution of scores much clearer. So, this means that it is possible to get an idea of how good or bad a score is relative to the entire group. 

Discover more about the z table.

#2: Comparison: 

Another great advantage of using the z score is related to the fact that you can easily compare scores that are measured on different scales. 

#3: The Area Under The Curve: 

If you think about it, you already know many different properties of the normal distribution. So, by converting to a normal distribution of z scores, you will be able to discover how many scores actually fall between certain limits. So, this means that you can then calculate the probability of a specific score occur. 

#4: The Area Between The Mean And Z:

Ultimately, this specific area of the table tells you the proportion of scores that are between the mean and a specific z score. Notice that this proportion is the area under the curve between those points. 

#5: Area Beyond Z:

This part of the table tells you the proportion of scores that are greater than a specific z score. 

Pitfalls Of Using The Z Score
Pitfalls Of Using The Z Score

#1: When you calculate the z score from raw scores, you may end up losing the meaningfulness of these raw scores. 

Understanding the z score table normal distribution. 

#2: Since you need to know the standard deviations to calculate the z score, you may also lose the meaning standard scores.

#3: When you are using the z score, you may end up magnifying small differences.

#4: Linear transformations require interval data and some of the data that you use may bot be interval level.
5 Ways To Detect Multicollinearity

One topic that tends to cause a lot of apprehension on statistics students is multicollinearity. 

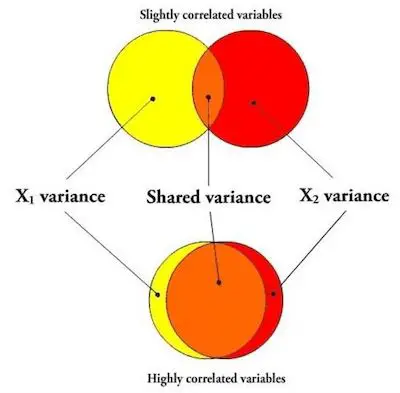
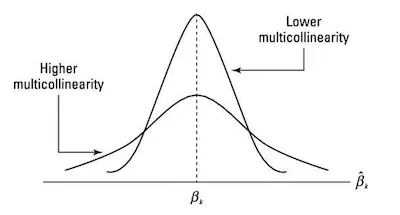
In case you don’t know or don’t remember what multicollinearity is, then you just need to know that multicollinearity occurs when 2 or more predictor variables overlap so much in what they are measuring that their effects cannot be distinguished. So, when you created a model to estimate the unique effects of these variables, then you can say that it goes wonky. 

Multicollinearity

Learn more about statistics.

One aspect that you need to always keep in mind is that multicollinearity may affect any regression model with more than one predictor. 

A Quick Example

Let’s say that you were trying to understand the different effects that temperature and altitude have on the growth of specific species of mountain trees. 

Multicollinearity - A Quick Example

As you know, both temperature and altitude are different concepts. Nevertheless, the mean temperature is so correlated with the altitude at which the tree is growing that you simply can’t separate both effects. While this seems pretty obvious, the reality is that it isn’t easy to prove that the model is wonky due to multicollinearity. 

Learn how to calculate standard error online.

One of the best and most used ways to detect multicollinearity is based on the bivariate correlation between 2 predictor variables. In case it is above 0.7, this means that you have multicollinearity. While you can easily understand that a high correlation between two predictors is an indicator of multicollinearity, there are two problems with treating this rule of thumb as a rule:

  • How high that correlation has to be before you’re finding inflated variances depends on the sample size. There is no one good cut off number.
  • It’s possible that while no two variables are highly correlated, three or more together are multicollinear. While this seems strange or weird, it happens.

So, in these cases, you’ll completely miss the multicollinearity in that situation if you’re just looking at bivariate correlations.

Discover how to use our standard error online calculator.

5 Ways to Detect Multicollinearity

Ways to Detect Multicollinearity

#1: The Overall Model Is Significant But Th Coefficients Aren’t:

Remember that a p-value for a coefficient tests whether the unique effect of that predictor on Y is zero. If all predictors overlap in what they measure, there is little unique effect, even if the predictors as a group have an effect on Y.

#2: Very High Standard Errors For Regression Coefficients:

When standard errors are orders of magnitude higher than their coefficients, that’s an indicator.

#3: Coefficients On Different Samples Are Very Different:

When you have a large sample, then simply split it into half and run the same model on both halves. Wildly different coefficients in the two models could be a sign of multicollinearity.

#4: Coefficients Have Different Signs From What You Were Expecting:

 Notice that not all effects opposite to the theory indicate a problem with the model. Nevertheless, it could be multicollinearity and warrants taking a second look at other indicators.

Check out this easiest standard error calculator.

#5: Big Changs In Coefficients When You Add Predictors:

When your predictors are independent, their coefficients will be maintained no matter if you add one or remove one. So, this may mean multicollinearity.


The Wisdom of Asking Silly Statistics Questions

When you are studying a new subject or topic, you should be afraid to ask questions as stupid or silly they may be. The reality is that if there is something that statistics make a lot of people feel is that they’re not that smart. Ultimately, we have to say that learning statistics for the same time may b a bit overwhelming. Nevertheless, people don’t want to show that they’re not understanding stuff. And this is quite common among statistics students. However, you should really ask questions even though it may seem that you are asking silly statistics questions. 

asking silly statistics questions

Discover everything you need to know about statistics.

The Wisdom of Asking Silly Statistics Questions

While you may think you are asking silly statistics questions and that you’re probably the only one who doesn’t get it, this is probably very far away from the truth. The reality is that most people prefer to keep their questions and doubts for themselves than to look “stupid”. But this isn’t how you evolve, this isn’t the right way to learning at all. 

Looking for a z score calculator?

#1: It’s Safe To Ask Questions:

It's Safe To Ask Questions

Ultimately, when you are in a statistics class, then go ahead and start asking silly statistics questions. You can be sure that many other students are struggling exactly with the same subject but they’re just too afraid to ask. No one will “eat you alive” just because you are trying to learn. This is actually a good thing. You want more knowledge, you want to develop your skills. 

#2: What Seems Basic At First Time Often Isn’t:

The reality is that it is normal to ask around when you’re learning a new subject. And more often than not, a topic or a question that may seem to have an obvious answer doesn’t. One of the most important things in data analysis is context. 

Check out our z value calculator.

#3: Even If You Ask A Basic Question, A Review Is Always Helpful:

Even If You Ask A Basic Question, A Review Is Always Helpful

While it is normal that you perform simple calculations since you do it every single day without even noticing, the reality is that there are things that you just don’t remember when you don’t use them often. 

As a statistics student, you are learning a wide range of different subjects and topics. And there are certain things that you may not remember anymore. And this is perfectly fine. 

Make sure to use our z stat calculator.

#4: There Are No Silly Questions:

For younger students in a classroom, it is normal for some to start laughing when a colleague asks a question that is silly to them. However, as we grow older, we start realizing that questions will always be on our minds. And this is a great thing. After all, you only have questions when you are trying to understand a new topic and you just can’t seem to pass that point. So, ultimately, you are trying to learn more. There are absolutely no silly questions. There are questions that are simpler or basic, and there are others that are more complicated or that have, at least, a more complicated answer. 


What Does The Z Table Tell You?

One of the most simple concepts that you will learn in your statistics classes is the z table. And the truth is that it can be quite helpful.

Discover everything you need to know about statistics.

What Is A Z Table?

Simply put, a z table is a mathematical table that allows you to determine the percentage of the values below a z score (to the left) in a normal standard distribution. One of the things that you may not know is that a z table is also known as the standard normal table.

Learn more about the z table here.

z table

In order to better understand and to even use a z table, you need to first know and calculate the z score. 

What is The Z Score?

Simply put, the z score which is also known as the standard score, tells you the number of standard deviations a raw score lays above or below the mean. 

It is worth to keep in mind that when you calculate the man of the z score, you will see that it is always zero. In addition, the variance or the standard deviation is always in increments of 1. 

Learn more about the calculation of the z score value.

How To Use A Z Table?

One of the things that you need to know about the z table is that it is actually divided into two different parts – the area to the left of a positive z score and the are to the right of a positive z score. So, let’s take a look at each one of these situations.

#1: Finding The Area To The Left Of A Positive Z Score:

If you take a closer look at the z score table, you will see that it usually uses the decimal figure. So, as you get this decimal value, you just need to multiple it by 100 to get its percentage. 

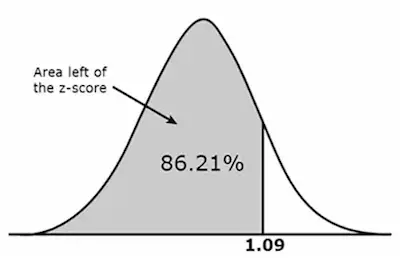
Let’s say that you just calculated the z score and that you got a value of 1.09. So, in this case, you will need to first take a look at the left side column of the z table to discover the value that corresponds to one decimal place of the z score. In this case, this is 1.0. 

Then, you will need to look up for the rest of the number. But this time, you’ll need to find the 0.09 on the top of the table. 

z score table

As you can see, the cell where both numbers intersect is equal to 0.8621. So, as we already mentioned above, you just need to multiply this decimal by 100 to get its percentage:

0.8621 X 100 = 86.21%

We can then say that the corresponding area is 86.21% below (or to the left) of the z score. 

z score representation

Discover more about the standard normal table.

#2: Finding The Area To The Right Of A Positive Z Score:

When you need to find the area to the right of a positive z score, the procedure is mainly the same. 

Ultimately, you just need to keep in mind that since the total area under the bell curve is 1 which is equivalent to 100%, then you will need to subtract the area from the table from 1. 

Let’s assume that you are using the same z score that you discovered above (1.09). As you already checked the table, you know that it corresponds to the decimal 0.8621. So, the area to the right of z = 1.09 is:

1 – 0.8621 = 0.1379

#3: Finding The Area To The Left Of A Negative Z Score:

Let’s say that you just calculated your z score and that you got a negative value. While this may seem confusing, you just need to ignore the negative sign and then subtract the area from the table from 1. 

#4: Finding The Area To The Right Of A Negative Z Score:

Again, you will simply need to disregard the minus signal and proceed the same way.


How To Use The Student’s T Test

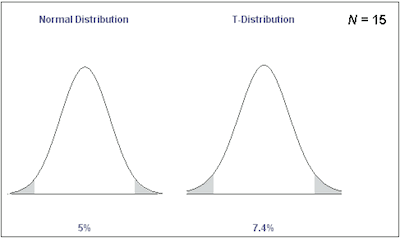
As you probably already know, the t distribution which is also known as the Student’s t, is a probability distribution that looks like a bell-shaped curve. This is also known as the normal distribution curve.

Learn more about statistics.

So, ultimately, if you keep sampling from a population in which the null hypothesis is true, then you know that the t distribution shows the long-run probabilities of various t values occurring.

So, what it the t value?

When you want to calculate a t statistic from your data set, you need to use a formula to test a sample mean:

student’s t test

Determine your student t-value here.

In case you discover that the null hypothesis is true, then this means that the sample mean would likely be close to the value you have under your hypothesis. 

Let’s take a look at an example so it can be easier to understand. Imagine that you have a sample mean that is equal to 52, which is close to the hypothesized mean of 50. This means that you would get a numerator will a value near zero. So, you can then conclude that the t statistic will also be close to zero.

t statistic example 1

Whereas, if your sample mean is further away from the hypothesized mean, let’s say 63, the resulting t statistic would be larger.

t statistic example 2

Now, it is the time to see when the t statistic that you just calculated lies on the t distribution. 

Since we are talking about a normal distribution, a bell-shaped curve, the data clusters about the mean. And while the values further away from the mean (i.e. toward the tails of the distribution) are not impossible if the null hypothesis is true, they are unlikely.

So, with the t distribution tables that are available online, you can get the critical values for the t distribution at different levels of significance. 

Check out our free student t-value calculator.

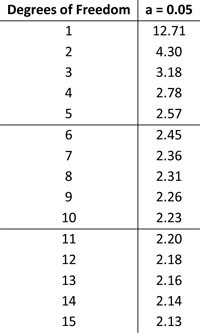
Here’s a screenshot of the table when alpha = 0.05:

table with alpha equal to 5

Notice that the underlying distribution is similar in the different tables. They only vary in what percentage of the distribution is being shown. 

The table we just displayed above tells you that for a specific degree of freedom, what value does 5% of the distribution lie beyond. 

For example, when df (degrees of freedom) = 5, the critical value is 2.57. This means that 5% of the data lies beyond 2.57. So, if your calculated t statistic is equal to or greater than 2.57, you can reject our null hypothesis.

Calculate your student t-value here.

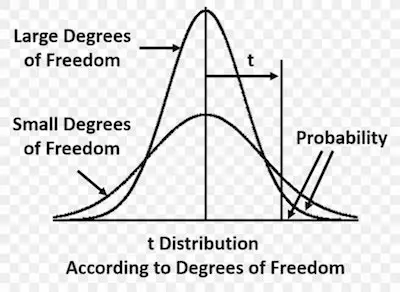
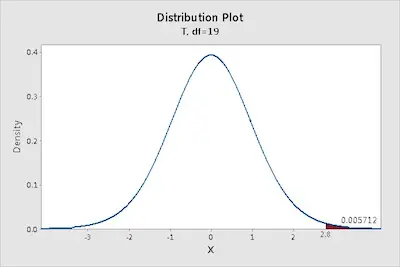
At this point, you need to also take a look at the p-values. In case you don’t know, p-values tell you the probability of obtaining your t statistic, or one more extreme, given the null hypothesis is true. That is, what area of the t distribution lies beyond our calculated t statistic?

t distribution

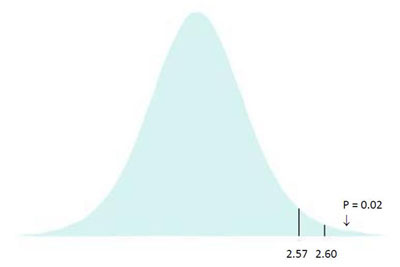
We already pointed out earlier that for 5 degrees of freedom, the critical t value is 2.57. So, this means that 5% of the distribution lies to the right of the line marking 2.57. 

As you can see above, if your sample mean was 63, you get a calculated t statistic of 2.60. 

The area to the right of this line gives you the p-value; the probability of getting this or more extreme, i.e. what area of the distribution lies to the right of 2.60. In this case, the answer is 2% of the distribution, giving you a p-value of 0.02.


Degrees Of Freedom For T Tests

In case you just started learning statistics or if you already had some classes about it, you probably already heard about degrees of freedom. 

Simply put, in statistics, the degrees of freedom indicate the number of independent values that can vary in an analysis without breaking any constraints. 

degrees of freedom

While this may seem a simple concept (and it is), you need to know that you will need to work with it in many different statistics fields. These include probability distributions, hypothesis tests, and even regression analysis. 

Understanding The Degrees Of Freedom

Before we show you more about the degrees of freedom for t tests, we believe that it is a good idea to tell you more about degrees of freedom in the first place. 

As we already mentioned above, the degrees of freedom are simply the number of independent values that a statistical analysis can estimate. In case this seems very technical, you just need to keep in mind that they are the number of values that can vary freely as you estimate parameters.

Check out our student t-value calculator.

different degrees of freedom

Notice that understanding the degrees of freedom is very simple. So, in case you prefer, you can look at them and keep in mind that they encompass the idea that the amount of independent information that you have may limit the number of parameters that you can estimate. 

In most cases, the degrees of freedom are equal to the difference between your sample size and the number of parameters that you need to calculate during an analysis. Besides, it is important to keep in mind that this is usually a positive whole number. 

As you can easily understand, the degrees of freedom are a mix or a combination of how much data you have and how many parameters you need to estimate. So, ultimately, the degrees of freedom show you how much independent information goes into a parameter estimate. 

When you understand this concept, it is easy to understand that it’s easy to see that you want a lot of information to go into parameter estimates to obtain more precise estimates and more powerful hypothesis tests. So, you want many degrees of freedom.

Calculate the student t-value using our free calculator.

Degrees Of Freedom For T Tests

Degrees Of Freedom For T Tests chart

As you probably already know, t tests are hypothesis tests for the mean and they use the t distribution to determine statistical significance.

When you are using the simple t test or the 1-sample t test as it is also known, you are looking to determine if the difference between the sample mean and the null hypothesis value is statistically significant. 

As you already know, when you have a sample and estimate the mean, you have n – 1 degrees of freedom, where n is the sample size. So, for a 1-sample t test, the degrees of freedom is n – 1.

Need help to determine the student t-value?

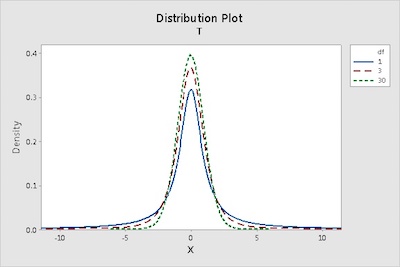
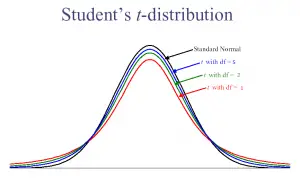
Notice that the degrees of freedom define the shape of the t distribution that your t-test uses to calculate the p-value. 

One of the things that is important to notice is that as the degrees of freedom decreases, the t-distribution has thicker tails. This property allows for the greater uncertainty associated with small sample sizes.


Measures Of Central Tendency: Advantages & Disadvantages

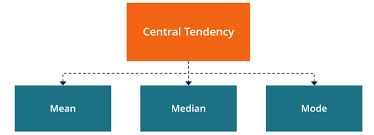
One of the first things that you learn in statistics is the measures of central tendency. These include the mean, the median, the mode, and the range. However, the first three are the most important ones and these are the ones that we will be looking at today. 

measures of central tendency

In case you don’t know or if you simply don’t remember, central tendency can be defined as the statistical measure that identifies a value that is capable of representing the entire distribution. 

Learn everything you need to know about statistics.

The main goal of using measures of central tendency is to get an accurate description of the entire data. After all, when you calculate the mean, median or mode, you are looking at a value that represents the entire data. 

#1: The Mean:

The mean can be defined in mathematical terms. After all, it is the average of all the terms. When you want to calculate the mean, you need to sum up all the values of all the terms and then divide by the number of terms. 

Advantages: 

  • You use all the available data
  • It’s a good option for ordinal or interval sets of data.

Disadvantages:

  • When the set of values that you have has an extreme value, then the mean isn’t representative. For example, when you have 4 6 9 2 4 59.

Click here to use our mean, median, mode, range calculator.

#2: The Mode:

The Mode

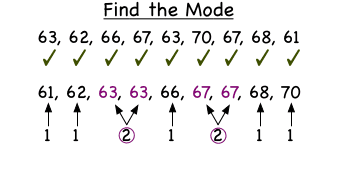
The mode can be described as the value of the term that occurs the most often. The truth is that it’s not uncommon at all for a distribution to include more than one mode, especially when there aren’t many terms. This occurs when two or more terms occur with equal frequency, and more often than any of the others.

Don’t know how to calculate mode?

Advantages:

  • The mode is always a value that is actually in the set of numbers. For example, in the sequence 3 6 3 11 4 3, the mode is 3. In case you would want to calculate the mean, then this sequence has a mean of 5 which is not actually a part of the sequence. 
  • This is the only measure of central tendency that is useful for nominal data. 

Disadvantages:

  • There are occasions where you can have more than one mode which makes the data less reliable. 

#3: The Median: 

The Median

One of the most important things to keep in mind about the median is that it needs to be calculated differently when you have a set of values that are odd or even. 

When you have an odd number of terms, then the median is the value of the term that is in the middle. On the other hand, when you have an even number of terms, then the median is the average of the two terms in the middle. 

Confirm if you calculated the median the right way with our free calculator.

Notice that when you want to calculate the median, you will need to order the values from the smallest to the largest. 

Advantages: 

  • Good to use with ordinal data.
  • Anomalies and extreme values don’t tend to affect it.

Disadvantages:

  • Doesn’t work well with small sets of data. 

Understanding The Mean And Median

There’s no question that the mean and median are two different measures that are widely used in statistics. After all, they are very effective when you want to describe the most typical value in a set of values. Notice that both mean and median are measures of central tendency. 

Use the best online statistics calculators.

The Mean And Median

As you can imagine, the mean and the median are two different concepts. And we believe that the best way to understand them is by showing an example. 

Let’s say that you draw a sample of 5 teenage boys and you measure their weights. You discover that they weight100 pounds, 100 pounds, 130 pounds, 140 pounds, and 150 pounds.

Now, you are asked to calculate both the mean and median. 

To calculate the mean of the sample, you will need to add all the observations and then divide them by the number of observations. So, in this specific example:

Mean = 100 + 100 + 130 + 140 + 150) / 5 

Mean = 620/5

Mean = 124 pounds

Click here to calculate the mean.

To calculate the median, you will need to arrange your data in order from the smallest to the largest value. You will then need to see if your sample size id odd or even. In case you have an odd number of observations, then the median is just the middle value. On the other hand, if you have an even number of observations, then the median is the average of the two middle values. So, in this specific example:

100 100 130 140 150

Since we have an odd number of observations (5), then the median is the middle value, 130 pounds. 

Click here to calculate the median.

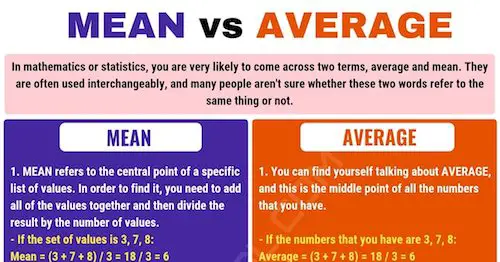
Mean Vs Median

mean-vs-median

One of the things that many students wonder is about the importance of each one of these measures of central tendency. However, it’s important to look at both the mean and median as measures that have advantages and disadvantages and not in terms of importance. 

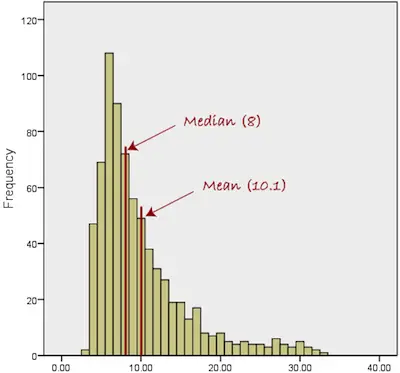
The median, for example, can be a better indicator of the most typical value if a set of scores has an extreme value that differs greatly from other values. On the other hand, it is also important to notice that when you have a very large sample size that doesn’t include these extreme values, then the mean is a better measure of central tendency. 

Check out our mean, media, mode, range calculator. 

But here’s a simple example so that you can fully understand these concepts and their advantages and disadvantages. 

Let’s say that you are looking at a sample of 10 households to estimate the family’s income. According to the data you collected, nine of the households have incomes between $20,000 and $100,000 but the tenth household has an annual income of $1,000,000,000. 

As you can see, the tenth household is an extreme value. So, if you want to use a measure of central tendency, then you should consider using the median. After all, if you use the mean instead, you will get an over-estimated value because of this tenth household. 

Bottom Line

As you can see, both the mean and median are important when you are analyzing data. However, using one or the other may be better depending on the samples that you need to analyze.


Understanding T Values And T Distributions

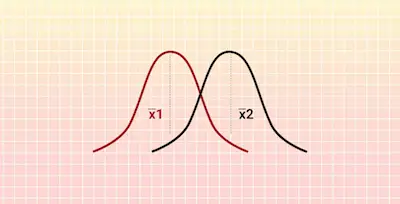
Simply put, a t test is a very useful hypothesis test in statistics. Ultimately, you can use the t test to compare means. 

t values

One of the things that you need to understand about t tests is that there are two different types of tests: the one-sample t test and the two-sample t test. While the first one allows you to compare a sample mean to a hypothesized value, the second one allows you to compare the means of two groups. When you have two groups with paired observations (e.g., before and after measurements), use the paired t-test.

Learn everything about statistics.

To better understand t tests, it is important that you understand t values as well as t distributions. And this is exactly what we are going to cover today. 

What Are T Values?

What Are T Values

T tests are all based on t values. So, you can see t values as an example of what statisticians call test statistics.

The reality is that a test statistic is just a standardized value that is determined from sample data considering a hypothesis test. The process or procedure that determines the test statistic compares your data to what is expected under the null hypothesis. 

One of the things that you need to keep in mind is that each type of t test uses a specific process or procedure to get to the t value. Notice that all the calculations to determine t values compare your sample mean to the null hypothesis and then incorporates both the variability in the data and the sample size. 

Looking to determine the student t value?

So, when you get a t value of 0, this means that the sample results exactly equal to the null hypothesis. Besides, keep in mind that the increase of the difference between the sample data and the null hypothesis leads to the increase of the absolute value of the t values. 

Notice that a t value per si doesn’t tell you anything. You need to have a background, a larger context in which you can place individual t values before you can interpret them. This is where t-distributions come in.

Make sure to use our student t value calculator.

What Are T Distributions?

t distributions

When you do a t test for a single study, you will get only one t value. On the other hand, if you have multiple random samples of the same size from the same population and do the same t test, you will get many different t values. So, with these t values, you can then plot a distribution of all of them. And this is known as the sampling distribution. 

One of the best things about sampling distributions is that you actually don’t need a lot of samples collected. The truth is that all the t distributions properties that are already known allow you to plot these different t values correctly. 

Check out our student t value calculator.

Notice that a specific t distribution is defined by its degrees of freedom which is a value closely related to the sample size. 

T-distributions assume that you draw repeated random samples from a population where the null hypothesis is true. You place the t-value from your study in the t-distribution to determine how consistent your results are with the null hypothesis.


When To Use A T Test?

Before we actually answer the question about when to use a t test, we believe that it is important that you know exactly what a t test is. 

Discover everything you need to know about statistics.

What Is A T Test?

t test

Simply put, a t test is a statistical test that was invented by William Sealy Gosset. This test serves to determine if two sample means (averages) or proportions are equal. 

Now that you already understand what a t test is (or at least, you remembered), it is time to know when you should use it. 

When To Use A T Test?

As we already mentioned, a t test is used to compare two proportions or means. So, we can then say that you can use a t test whenever you want to compare means. However, in order to use the t test, some assumptions need to b met. We will take a look at these assumptions below. 

One of the things that you need to keep in mind about the t test is that it is only a good idea to use a t test when the proportions or means are good measures. 

Make sure to use our student t value calculator.

Matched And Unmatched T Tests

It’s important to notice that there are two different forms of the t test: the matched t test and the unmatched t test. So, what’s the difference between the two?

In a matched t test, the two samples are not independent. Just think of the length of people’s left and right feet. These are dependent. After all, when you know the size of your left foot, you immediately know the size of your right foot.

In an unmatched t text, the two samples are independent. This is why this test is also known as the independent t test. As you can easily understand, this means that when you know something about one variable, it won’t affect the other one. For example, the heights of men and women drawn randomly from a population. The truth is that a specific height of a man doesn’t tell you anything about the height of any specific woman. 

Need help to determine the student t value?

T Test: The Assumptions It Needs To Meet

t text assumptions

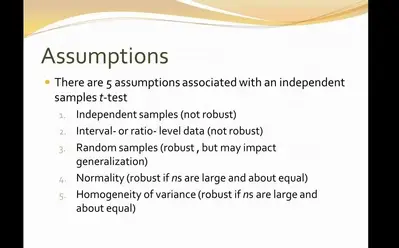
As we mentioned above, to do a t test, you need to ensure that both samples are independent. Besides, one of the things that you may not know is that both types of t tests assume that the variances of the populations are always equal. 

So, in case you don’t have this last criteria met, you need to know that there are different things you can do to adjust for unequal variances, provided that the sample sizes of the two samples are approximately equal. 

Notice that it is possible that you have two very different variances as well as two very different sample sizes. When this happens, you shouldn’t use the t test.

Discover if you got the right t value.

So, What Do You Use?

In statistics, there are many other tests that can be performed. When you find out that it’s not appropriate to conduct a t test, then you should consider other alternative tests such as the Wilcoxon’s test or the permutation test.