Category : Blog

Covariance In Statistics

We can definitely state that covariance is one of the most common and basic measurements when you are talking about statistics. But what is covariance?

covariance

Simply put, covariance is the measurement of how much two random variables can vary together. While you may think that covariance is very similar to variance, the truth is that while variance tells you how just one single variable varies, covariance tells you how two different variables vary together. 

Make sure to use the top statistical calculators online.

The Covariance Formula

In order to determine the covariance between two different variables, you can use the following formula: 

Cov(X,Y) = Σ E((X-μ)E(Y-ν)) / n-1 

Where,

X = a random variable

E(X) = μ = the expected value, or the mean, of the random variable X

E(Y) = ν = the expected value, or the mean, of the random variable Y

n = number of items in the data set

Covariance Example

The truth is that while you may have completely understood what covariance is, there is nothing better than a simple example to see how everything works out. 

Let’s say that you want to determine the covariance for the following data set: 

x: 2.1, 2.5, 3.6, 4.0 (mean = 3.1)

y: 8, 10, 12, 14 (mean = 11)

Discover the two sample t test explained.

Now, you just need to replace the values in the formula that we just showed you above: 

Cov(X,Y) = ΣE((X-μ)(Y-ν)) / n-1

Cov(X,Y) = (2.1-3.1)(8-11)+(2.5-3.1)(10-11)+(3.6-3.1)(12-11)+(4.0-3.1)(14-11) /(4-1)

Cov(X,Y) = (-1)(-3) + (-0.6)(-1)+(.5)(1)+(0.9)(3) / 3

Cov(X,Y) =  3 + 0.6 + .5 + 2.7 / 3

Cov(X,Y) =  6.8/3

Cov(X,Y) =  2.267

Since the covariance result is positive, we can then say that the variables x and y are positively related. 

Covariance – The Problems With Interpretation Of The Results

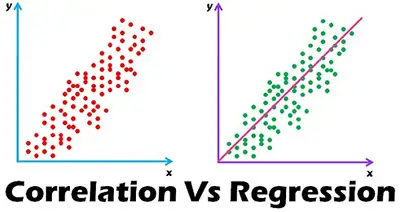
correlation-vs-covariance

One of the things that you need to know about covariance is that there may be some problems with the interpretation of the results. 

When you have a large covariance, this can suggest a strong relationship between the two variables you are considering. Nevertheless, you just can’t compare the variances of data sets that have different scales. This means that if you want to compare a data set expressed in inches with a data set expressed in inches, you can’t do it. 

One of the main problems that you have, when you are trying to interpret the results of covariance, is when you have a wide range of results. 

Take a look at some Z test example problems.

Let’s say that your data set can give you a value anywhere between 1 and 1,000. This may lead to a simple problem: the larger the values of the X and the Y, the larger the covariance will be. Let’s assume that you get a covariance result of 100. This value tells you that the two variables are correlated but you can’t notice how strong this relationship is. 

When you are in such a case, the best thing you can do is to divide the covariance by the standard deviation. This way, you will get the correlation coefficient. 
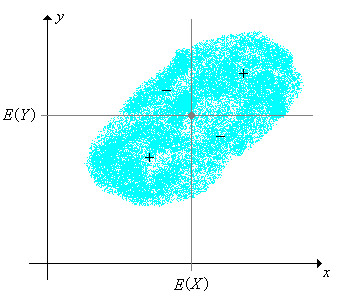
covariance-and-correlation

Learn more about quantitative reasoning.

But why should you use the correlation coefficient?

The reality is that on some occasions, it is better to use the Correlation Coefficient rather than the covariance. After all:

– Correlation tends to be more useful to determine how strong the relationship between two different variables is because covariance has numerical limitations.

– Covariance results can be any number while correlation results need to be between -1 and +1. 

– Correlation isn’t usually affected by the scale of the variables or by the mean (or the center).

– While correlation doesn’t’ have units, covariance has units. 
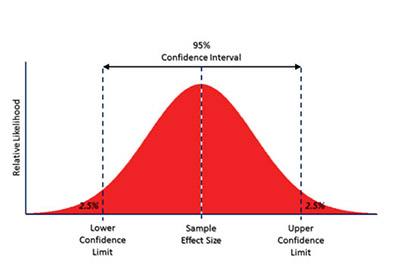

How To Find A Confidence Interval

When you are learning statistics, it’s common to hear about a confidence interval. But what exactly is a confidence interval?

Simply put, a confidence interval is a way that you have to know about how much uncertainty there is with any specific statistic. One of the things that you need to keep in mind is that a confidence interval is usually used with a margin of error. 

confidence-interval

Take a look at the different statistical tables that you can use in statistics.

Overall, a confidence interval tells you how confident you can be about the results from a survey or from a poll to reflect what you expect to find if it was possible to do it for the entire population. 

Confidence Intervals Vs. Confidence Levels

One of the things that you need to know is that a confidence interval is directly related to a confidence level. 

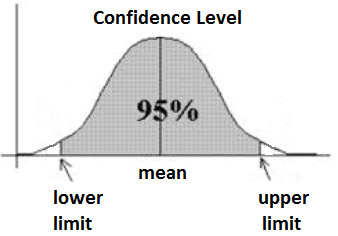
confidence-level

A confidence level is usually expressed in terms of a percentage. Most of the times, you will see polls and surveys stating that they used a confidence level of 95%. This means that in case you repeat the exact same survey or poll over and over again, 95% of the time your results will match the results you get from a population. On the other hand, a confidence interval is a result that you get. Ley’s say that you made a quick survey to a small group f pet owners to see how much cans of dog foods they purchase a year. 

If you test your statistics at the 99% confidence level and if you get a confidence interval of (200,300), this means that you believe that these owners will buy between 200 to 300 cans of dog food each year. Besides, you are incredibly confident that this will occur – 99%. 

Learn more about how to conduct a t test in excel.

Applying Confidence Intervals To Real Life Examples

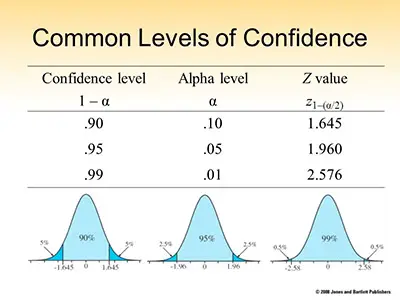
common-levels-of-confidence

The United States Census Bureau usually uses confidence levels of 90% in most of the surveys they do. Back in 1995, they did a survey about the number of people in poverty and they stated that they were using a 90% confidence level. According to them “The number of people in poverty in the United States is 35,534,124 to 37,315,094.” 

Check out this paired t test example.

But what does this mean exactly? 

Simply put, this means that if the United States Census Bureau was about to repeat this same survey over and over again using the same techniques is that 90% of the time, the results would always be between 35,534,124 and 37,315,094 people in poverty. So, we can say that the (35,534,124 to 37,315,094) is the confidence interval.

Confidence Interval – A Simple Example

Let’s say that you have a group of 10 patients who need foot surgery who have a mean weight of 240 pounds. You also know that the sample standard deviation was 25 pounds and that you need to find the confidence interval for a sample to ensure the right mean weight of al foot surgery patients. Consider a 95% confidence interval. 

confidence-level-scale

Discover how you can do an unpaired t test for two samples.

In order to solve this problem, you need to follow the next steps:

Step #1: Determine The Degrees Of Freedom

Take your sample size and subtract one. So, you will get:

10 – 1 = 9

Step #2: Subtract the confidence level from 1, and then divide by 2:

(1 – .95) / 2 = .025

Step #3: Now, you need to look at the answers that you got in both steps 1 and 2 and search for them in the t-distribution table. 

Since you had 9 degrees of freedom and an α = 0.025, your result is 2.262.

Step #4: Now, it is time to divide your sample standard deviation by the square root of your sample size:

25 / √(10) = 7.90569415

Step 5: And now you need to multiply the result you got on step 3 and the result you got on step 4:

2.262 × 7.90569415 = 17.8826802

Step 6: Now, you need to determine both the lower and the upper end of the range:

– The lower end of the range: 

240 – 17.8826802 = 222.117

– The upper end of the range:

240 + 17.8826802 = 257.883

And you just discovered the confidence interval. 


The Chi-Square Goodness Of Fit Test

In case you never heard about the chi-square goodness of fit test before, you need to know that this is the test that should be applied when you have one categorical variable from one single population. The chi-square goodness of fit test is usually used to determine if the sample data is consistent with the distribution that was hypothesized. 

Make sure to try out our free stats tables and calculators.

chi-square-goodness-of-fit-test

Let’s say that some company decided to print some baseball cards. They state that about 30% of their cards are rookies, about 60% of their cards ate veterans but not All-Stars, and about 10% of their cards were veteran All-Stars. 

If you decide to pick a random sample of these baseball cards and you use the chi-square goodness of fit test, you will be able to determine if your sample distribution differed significantly from the distribution that the company said it had. 

When Should You Use The Chi-Square Goodness Of Fit Test

There are some specific situations when you should consider using the chi-square goodness of fit test. These include: 

– When the variable that you want to study is categorical

– When the sampling method that is used is a simple random sampling.

– When the expected value of the number of sample observations in each degree of the variable is at least 5. 

Use our calculator to determine the critical chi-square value.

Conducting The Chi-Square Goodness Of Fit Test

When you want to perform the chi-square goodness of fit test, you need to understand that it requires four different steps:

Step #1: State The Hypothesis

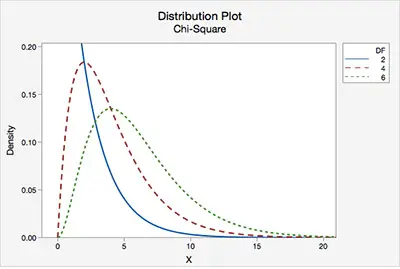
chi-square-goodness-of-fit-test-distribution-plot

When you are conducting a hypothesis test like the chi-square goodness of fit test, you need to have a null hypothesis (Ho) and an alternative hypothesis (Ha). You need to ensure that when you formulate them, they are mutually exclusive. This means that if one of the hypothesis is true, the other hypothesis needs to be false, and vice-versa. 

For a chi-square goodness of fit test, you should use the following hypothesis:

– Ho: The data is consistent with the specified distribution

– Ha: The data isn’t consistent with the specified distribution

Discover a reliable tool for chi square test online.

Step #2: Formulate Your Analysis Plan

During this step, you will need to specify some elements:

– The Significance Level: While most researchers tend to use significance levels of 0.01, 0.05, or 0.10, you can use any value between 0 and 1. 

– The Test Method: You will need to state that you are going to use the chi-square goodness of fit test to determine if the observed sample frequencies differ significantly from the expected frequencies specified within your null hypothesis. 

Step #3: Analyze The Sample Data

conducting-the-chi-square-goodness-of-fit-test

Now, it is time to proceed with the calculations. During this step, you will need to take your sample data and determine:

– The Degrees Of Freedom: This is equal to the number of levels (k) of the categorical variable minus 1

DF = k – 1

Learn how to find the Z score.

– The Expected Frequency Counts: When you look at these for each level of the categorical variable, you will see that these are equal to the sample size times the hypothesized proportion from the null hypothesis

Ei = n*p*i

where,

Ei = expected frequency count for the ith level of the categorical variable

n = total sample size

pi = hypothesized proportion of observations in level i.

– The Test Statistic: This one is defined by the equation:

Χ2 = Σ [ (Oi – Ei)2 / Ei ]

where,

Oi = observed frequency count for the ith level of the categorical variable

Ei = expected frequency count for the ith level of the categorical variable. 

– The P Value: The P value is the probability of observing a sample statistics as extreme as the test statistic. 

Step #4: Interpret The Results

In the case that your sample findings are unlikely, then you will reject the null hypothesis. 


Understanding The F Test

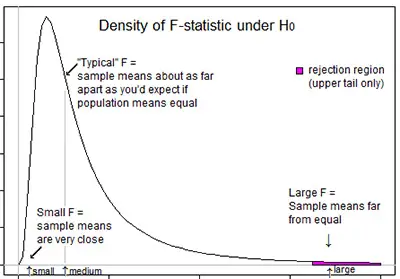
Simply put, an F test is a kind of catch-all term for any tests that you make that use the F-distribution. In most cases, when someone is talking about an F test, they are simply talking about the F-test to compare two variances. Nevertheless, you must understand that the F-statistic is used in many different tests including the Scheffe Test, the Chow test, and even regression analysis. 

Discover all the statistic calculators you can use for free. 

Following The Steps To Do An F Test

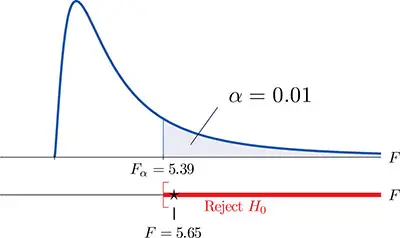
F-test-1

In case you want to run an F test, you need to know that doing it by hand can become a bit tedious and slow. So, instead, you can use some technology to run it such as Minitab, SPSS or even Excel. 

While some of the steps that we are about to show you are immediately done by technology, it is important that you know exactly what you are doing when you are running an F test. 

Step #1: The first thing that you always need to do when you are running a test is to define your hypothesis. So, you will need to state both the null hypothesis as well as the alternative hypothesis.

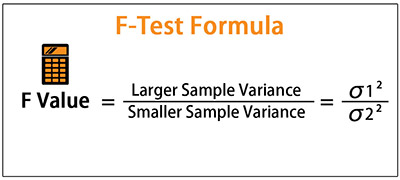
F-Test-Formula

Discover how to determine the critical F value.

Step #2: The next thing that you need to do is to calculate the F value. To do so, you will need to use the following formula:

F = (SSE1 – SSE2 / m) / SSE2 / n-k

where,

SSE = the residual sum of squares

m = the number of restrictions

k = the number of independent variables.  

Use our calculator to determine the F critical value easily.

Step #3: As soon as you determine the F value, you will need to find the F statistic which is the critical value for this test. To determine the F statistic value, you can simply use the following formula:

F Statistic = variance of the group means / mean of the within-group variances

So, you can find the F statistic in the F-table. 

Step #4: This is the step where you can finally conclude if you support or reject the null hypothesis. 

F Test T Compare Two Variances

statistics

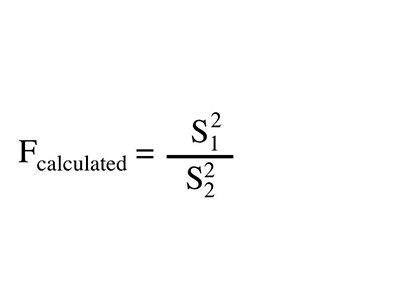
As we already mentioned above, the statistical F test can use an F statistic to compare two variances. This is done by dividing them (s1 / s2). One of the things that you need to know is that this result is always positive. 

The formula used is: 

F = s21 / s22

In case the variances are equal, this means that the ration of the variances just displayed above is equal to 1. 

One detail that you should always remember is that in this test, you will always be testing that the population variances are equal. So, we can also say that you always need to assume that the variances are equal to 1. So, and following what we already know, your null hypothesis will always be that the variances are equal. 

Looking for a free calculator to determine the F critical value?

Assumptions

F-calculated-formula

Some of the assumptions that are made for the test include:

– The larger variance that you have should always go in the numerator so that you can get a right-tailed test that us easier to calculate.

– In case you have two-tailed tests, you will need to divide alpha by 2 before you even determine the right critical value.

– In case you only have the standard deviations, you will need to square them to get the respective variances. 

– In case your degrees of freedom aren’t listed in the F table, you will need to use the larger critical value to avoid any Type I errors. 


A Better Understanding About The F Statistic

When you are learning statistics, you will need to understand what the F Statistics is and what it is used for. So, let’s get started with the F Statistics definition.

What Is The F Statistic?

F-statistic

Simply put, the F statistic is the value that you get when you do a regression analysis or you run the ANOVA test to try to find out if the mean between two populations ate significantly different. 

Discover everything you need to know about statistics.

The truth is that the F statistic is very similar to the T statistic. After all, while the T test will allow you to know if a single variable is statistically significant, the F test will allow you to determine if a group of variables is jointly significant. 

What Is “Statistically Significant”?

Statistically-Significant

One of the questions that we keep getting, especially from statistics students, is about what means to be statistically significant. In case you also have the same question, let us clear that for you.

Simply put, when you have a significant result, this means that your results likely didn’t happen by chance. On the other hand, when you don’t have a statistically significant result, this means that you can’t get to a real result. So, this means that you can’t reject the null hypothesis. 

Use our calculator to determine the critical F value.

Using The F Statistic

When you are looking to either support or reject the null hypothesis, you need to determine the F statistics. One of the things that you need to know is that in your F test results, you will have an F critical value and an F value. 

Notice that the F critical value is also known as the F statistic and that the value that you determine from your data is called F value. 

learning-statistics

Looking to calculate the critical F value?

Overall speaking, when your F value in a test is larger than your F statistic, this means that you can reject the null hypothesis. However, you need to keep in mind that the statistic is only one measure of significance in an F test. This means that you also need to determine the p value. Simply put, the p value is determined by the F statistic and is the probability that your results may have happened by chance. 

The F Statistic And The P Value

As we have just shown you, it is very frequent to use the p value combined with the F statistic when you are trying to determine if your results are significant. This is because if you have a significant result, it just doesn’t mean that all your variables are significant. The reality is that the statistic is simply comparing the joint effect of all the variables together. 

F-test

Discover how to easily determine your F critical value.

Let’s say that you are using the F statistic in regression analysis. This may occur because there was a change in the coefficient of determination or a change in the R squared. So, in this case, you will need to use the p value to get the “big picture”. 

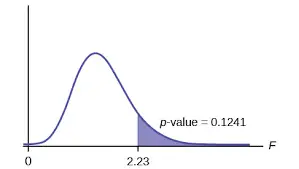
In case you get a p value that is less than the alpha value, which is usually considered 0.05, you should proceed with the test. On the other hand, when the p value is more than 0.05, this means that your results aren’t significant and therefore, you can’t reject the null hypothesis. 

Ultimately, you will need to study the individual p values to determine which ones of the variables you are studying are statistically significant. 


Understanding The P Value

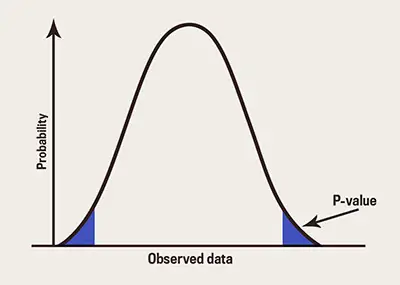
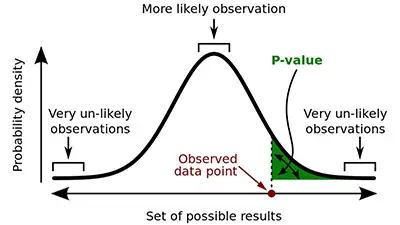
The P value is very used in statistics. Simply put, the P value is the level of marginal significance within a specific statistical hypothesis test that represents the probability of a specific event to occur. 

The P value tends to be used as a different test to reject points. This way, the P value is able to provide the smallest level of significance at where the null hypothesis can be rejected. 

P-value

Make sure that you use the best statistical calculators online for free.

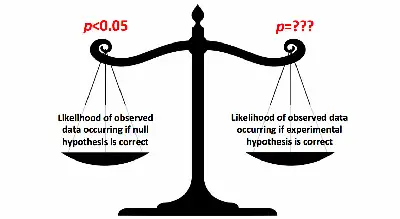
The smaller the P value is, the stronger is the evidence in favor of the alternative hypothesis. 

Calculating The P value

In order to calculate the P value, you need to use the P value tables or a statistical software. 

calculating-the-P-value

One of the things that you should keep in mind is that not all researchers use the same levels of significance. So, this means that when you are examining a question, you may have some difficulties comparing the results from two different tests. So, what researchers usually do is that they tend to include the P value directly on the hypothesis test. This allows you to know and interpret the statistical significance on your own. This is often referred to as the P value approach to hypothesis testing. 

Discover everything you need to know about the ANOVA F value.

P Value Approach To Hypothesis Testing

limitations-of-the-P-value

When you are looking to determine the P value this way, you will need to use the calculated probability in order to calculate if there is any evidence that allows you to reject the null hypothesis. Just as a side note, the null hypothesis is the initial claim that you make about a population of statistics. 

Then, you have the alternative hypothesis. This alternative hypothesis should state if the population parameter is different from the value of the population parameter that you established on the null hypothesis.  

Take a look at this reliable tool for Chi Square test.

The Type I Error

reading-the-P-value

Many times, when you are reading about the P value approach to hypothesis testing you will see the mention to a type I error. 

Simply put, the type I error is the false rejection of the null hypothesis. You need to understand that the probability of a type I error to occur or to reject the null hypothesis when this one is true is similar to the critical value or P value that you used. On the other hand, the probability of accepting the null hypothesis when this one is true is similar to 1 minus the critical value or P value. 

Discover what range means in math.

Quick Facts About The P value

– When you are doing a statistical hypothesis test, the P value is the level of marginal significance that represents the probability of a specific event to occur.

– In order to determine or calculate the P value, you need to use either a statistical software or the P value tables.

– When you have a P value that is small, this means that there is a strong evidence of the alternative hypothesis to be accepted. 


The Different Types Of Correlation

As you probably already know, correlation is a widely used statistical tool. Correlation is a way that you have to measure the relationship between two or more variables that don’t need to be classified or identified as dependent or independent. All that you are looking for is to see or understand if the movement of one variable is followed by the movement of another variable. 

types-of-correlation

Use the best free online stats calculators.

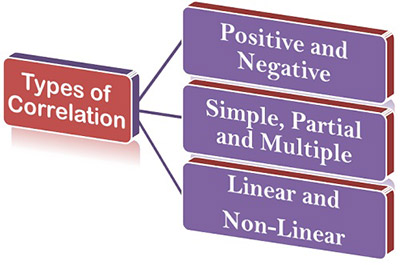
One of the things that you may not know about correlation is that there are different types of correlation. 

Types Of Correlation

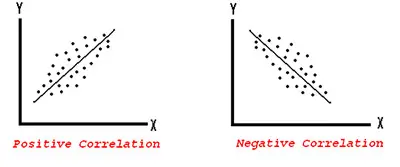
#1: Positive and Negative Correlation:

Positive-and-Negative-Correlation

In order to determine if the correlation is positive or negative, you will need to check the direction of the change. 

So, you can say that the correlation is positive when all the variables move in the same direction. This means that if one of the variables increases, you will see the other one increase as well. In case one of the variables decreases, the other one decreases as well. 

Discover the main sources of data in statistics.

You can say that the correlation between two variables is negative when they move in opposite directions. This means that you have a negative correlation when a variable is increasing and the other one is decreasing or vice-versa. 

#2: Simple, Partial and Multiple Correlation: 

Simple,-Partial-and-Multiple-Correlation

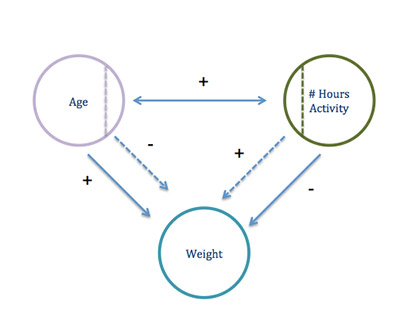
When you are trying to determine if the correlation is simple, partial or multiple, you will now need to look at the number of variables that you are studying. 

You can say that the correlation is simple when you are only studying two variables. In case you are studying three or more variables, you can have a partial or a multiple correlation. In case you are studying three variables simultaneously (at the same time), you can say that the correlation is multiple. 

Learn more about the ANOVA F value.

#3: Linear and Non-Linear (Curvilinear) Correlation: 

Linear-and-Non-Linear-(Curvilinear)-Correlation

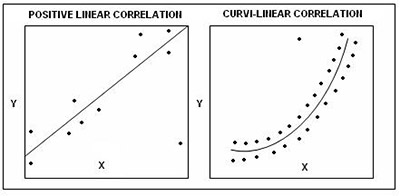
When you are trying to determine the types of correlation and you want to check if the correlation between variables is linear or non-linear, you will need to look at the constancy of the ratio of change between the two variables you are analyzing. 

You can say that you are using a linear correlation when the amount of change in one of the variables to the amount o change in the other variable is near a constant ratio. 

Let’s say that you have the following sets of data for two different variables:

Variable X: 10 20 30 40 50

Variable Y: 20 40 60 80 100

As you can see, when you are comparing the variables X and Y, you can easily see that the ratio of change between them is the same. 

Check out this F test example.

On the other hand, you can say that you are dealing with a non-linear or curvilinear correlation when the amount of change in one variable is not a constant ratio to the amount of change in the other variable. 

Conclusion

As you can easily see, you have mainly three different types of correlation. The way that you determine the correlation type depends on whether you are looking at the movement of the variables, to the number of variables you are analyzing, or to the ratio of change between the variables. 


The Mann-Whitney U Test

The Mann-Whitney U test is a non-paramedic test that you can use when you don’t want to perform an unpaired t test. 

What Is The Mann-Whitney U Test

Mann-Whitney-U-test

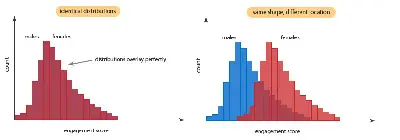
The Mann-Whitney U test is usually used to test the null hypothesis that two samples come from the same population which means they have the same median. However, you can also perform the Mann-Whitney U test when the observations in one sample are usually larger than observations on a different sample. 

Discover the best free online statistic calculators and tables.

How To Use The Mann-Whitney U Test

Let’s say that you have a sample of nx observations {x1, x2, . . . xn} in group 1 from one population, and that you have ny observations {y1, y2, . . . yn} in group 2 from a different population. 

According to the Mann-Whitney U test, you will need to compare every single observation xi in the first sample with every single observation xj in the other sample. 

The total number of comparisons that you will get is made by nx*ny.

In the case both samples have the same median, this means that every single xi has the same probability of being smaller or greater than each yi. 

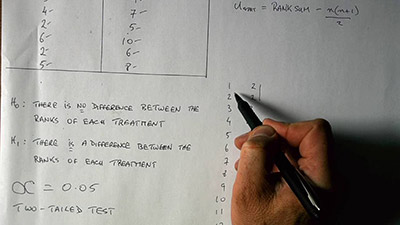
calculating-the-Mann-Whitney-U-test

So, you will need to formulate the two hypothesis:

The null hypothesis: H0 : P(xi > yj ) = 1/2

– The alternative hypothesis: H1: P(xi > yj ) ≠ 1/2

You will then need to count the number of times where the xi from sample 1 is greater than yi from sample 2 and you will call it Ux. 

Then, you’ll need to do the opposite. You will need to count how many times the xi from sample 1 is smaller than yi from sample 2 and you will call it Uy. 

According to the null hypothesis, you will nee the Ux and the Uy to be equal or, at least, very close to each other. 

Confirm your results by using our Mann-Whitney U Test calculator.

Performing The Mann-Whitney U Test

Step #1: 

You will need to order all the observations in order of magnitude.

Step #2: 

Look at each observation that you have and signal them as X or Y depending on the sample they are from. 

Learn how to calculate mean, median, mode, and range.

Step #3:

Mann-Whitney-U-test-using-SPSS

Here, you will need to annotate the values for which the xi is greater than the yi as well as the opposite:

– look at the x and write down the number of ys that are smaller than it (or to its left)

– look at the y and write down the number of xs that ate smaller than it (or to it left).

Step #4: 

Now, it is time to determine the Ux and the Uy. As we already mentioned earlier, the UX is the total number of times that the xi > yj. Similarly, the Uy is the total number of times that the yj > xi.

At the end, you will need to confirm if Ux + Uy = nx*ny

Step #5: 

In this step, you will need to determine the U = min(Ux, Uy).

Step #6: 

Now, you will need to have the statistical tables for the Mann-Whitney U test near you. You will need to discover the probability of observing a value U or lower. 

In case your test is just one-sided, you will get your p-value. However, in case your test is a two-sided test, then you’ll need to double the probability that you get to determine the p value. 

These are the most common probability problems.

Let’s say that you have a tie meaning that you have two or more observations that are the same. In this specific case, you can still determine the U value the same way as before. Nevertheless, you will need to calculate the normal approximation by using an adjustment to the standard deviation. 


Normality Tests for Statistical Analysis

One of the things that you may not know is that statistical errors tend to be quite common. The reality is that many of the statistical procedures that you see published such as analysis of variance, t tests, regressions, and correlations tend to assume that the data follows a Gaussian distribution also known as normal distribution. However, when you do this and when you are looking to build reference intervals for variables, this can cause some problems. 

normality-tests

Check out our free statistical calculators.

One of the things that you always need to keep in mind is that normality tests should be taken seriously or your conclusions may be affected. 

While when you are using large sample sizes such as more than 30 or 40 there shouldn’t be major problems. After all, the violation of normality can be fought using paramedic procedures. The reality is that when you have hundreds of observations, you can simply ignore the distribution of the data. 

Using Visual Methods

When you are trying to check the normality of the data, you can do a visual inspection. However, you need to know that this method is not very reliable and it really doesn’t guarantee that you are dealing with a normal distribution. 

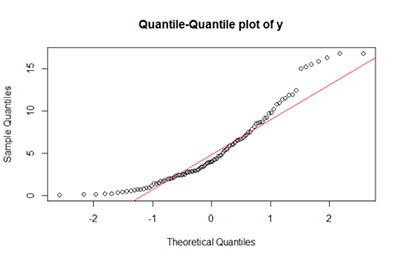
normality-tests-Q-Q-plot

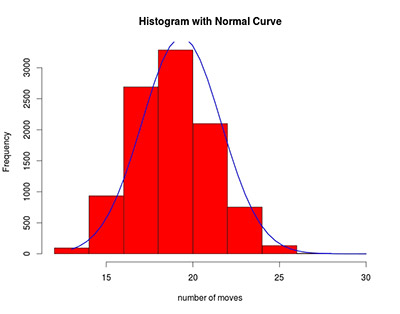
There are many different methods that you can see to determine if the data is distributed normally. These include quantile-quantile plots, probability-probability plots, boxplots, stem-and-leaf plots, frequency distribution or histogram, among others. This will allow you to see if the data forms the bell curve or not. 

Learn the basic statistic formulas that you need to understand.

Normality Tests

Normality tests can also be used to determine if the data is normally distributed. It is often seen as a supplementary approach to the graphics used under the visual methods. 

normality-tests-for-large-sample

There are many different normality tests that you can perform. The most important ones include:

– Cramer-von Mises test 

– Lilliefors corrected K-S test

– D’Agostino-Pearson omnibus test

– Kolmogorov-Smirnov (K-S) test

– Jarque-Bera test

– Anderson-Darling test

– Anscombe-Glynn kurtosis test

– Shapiro-Wilk test

– D’Agostino skewness test

These are the best introductory statistics books.

These normality tests usually compare the scores in the sample to a normally distributed set of data with the same standard deviation and the same mean. 

In this case, the null hypothesis will always be “sample distribution is normal”. In case the test is significant, then you will be able to conclude that the distribution is non-normal. 

normality-tests-in-SPSS

Check out our paramedic calculator.

When you have small sample sizes, you need to understand that normality tests may not be very useful. The reality is that normality tests tend to almost always to accept the null hypothesis. 

On the other hand, when you have large sample sizes, it’s a good idea to use normality tests. The reality is that you should get a significant result even when the deviation is small.

Conclusion

When you are looking to determine the normality assumption, you should take into account the use of paramedic statistical tests. One of the tests that was usually used to access normality tests used to be the K-S. However, this is no longer the case anymore. The reality is that it is now considered to have very little power. So, when you are trying to use normality tests, you should definitely consider using the Shapiro-Wilk test which is provided by the SPSS software.  


Understanding The Difference Between Correlation And Linear Regression

When you are learning about statistics, there are two concepts that you usually learn at the beginning – correlation and linear regression. However, according to our experience, we believe that most people don’t quite understand the difference between these two concepts. So, we decided to give you a hand so that you can finally see the difference. 

Discover the best online statistic calculators.

Correlation

correlation

Correlation is simply a measure of association between two different variables. These are just known as variables and they can’t be designated either as independent or dependent. 

Simple Regression

When you are looking to establish a link or a connection between a dependent variable and the independent variable, the process is called simple regression. So, when you do this analysis, you will then use the regression statistics to try to predict the dependent variable when you already know the independent variable. So, as you can see, linear regression goes beyond correlation. It doesn’t only determine the relationship between a dependent variable and the independent one as it uses the data to predict the dependent one. 

linear-regression

Learn more about quantitative reasoning.

One of the things that you may haven’t noticed is that you keep using linear regression on a daily basis. You know that when you go to bed late, you will have a hard time waking up in the morning. If you are a mother, you know that when your child eats a lot of sugar his energy levels will be higher. While you already know this, the linear regression, and more specifically the quantitative regression, allows you to add precision by using a mathematical formula. 

Let’s say that a medical researcher is trying to determine the best dose for a new drug depending on body weight. In this case, the body weight is the independent variable and the dose for the new drug is the dependent variable. 

These are the best introductory statistics books.

By doing a linear regression, the medical researcher is trying to determine a formula that fits the relationship between the two variables. As soon as they get to the formula, they will be able to recommend the right dose for a specific body weight. 

The Type Of Data

correlation-vs-regression

The type of data is also an important factor to take into consideration. The truth is that when you are looking at correlation, this is almost always used to measure both variables. On the other hand, when you are dealing with linear regression, you know that you need to use it when X is a variable that you can manipulate. This can be concentration, time, among others. 

Don’t know how to calculate P value from Z by hand?

The Different Types Of Variables

As we already mentioned above, when you are looking at correlation, you don’t classify the variables as dependent or independent. There is no cause or effect.

However, when you are looking at linear regression, there is the need to be an independent variable and a dependent variable. 

Relationship Between Results

When you are calculating the correlation between two variables, your results will always be between -1 and +1.