Category : Chi-Square

Chi square calculator

What is the chi-square test?

Before you use our chi square calculator we want you to be informed about the chi-square test. It is a statistical hypothesis test used to see if a data set fits a particular distribution. Calculating chi-square can be done in two ways. One method is by finding the expected frequencies and the other way is by calculation of degrees of freedom and critical value.

The hypotheses for this research are:

Null Hypothesis: The distributions of the data set fit a normal distribution.

Alternative Hypothesis: The distributions of the data set do not fit a normal distribution.

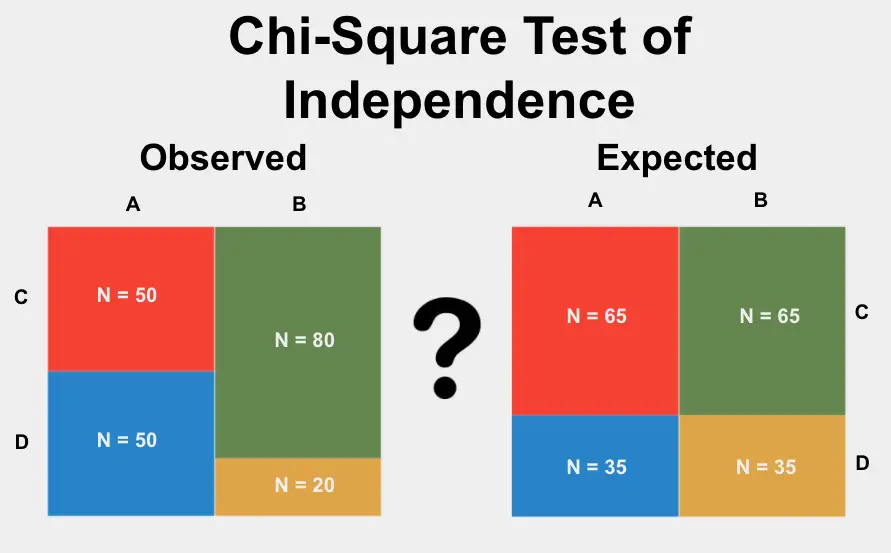
The chi-square test is used to test whether or not there is a significant difference between two types of categorical variables in sample size, and it gives a value for each variable type. This test is used to find whether the expected frequency in each category of one variable matches with the observed frequency in a different variable, and if so, which category is more probable.
Chi square calculator

Calculating chi-square using a total number of frequencies:

1) Find the degrees of freedom for this research question by taking (r-1)(c-1), where r is for the number of rows of data and c is for the number of columns. In this case df = (4-1)(3-1)= 4

Click here to use chi square calculator for free

2) Find the critical value by going to an online table or a more comprehensive chart with degrees of freedom under “5” and find the closest chi-square value, or, alternatively use online software to calculate the critical value.

3) Calculate chi-square using the total number of frequencies by using the formula where Oi is observed items in category i, Ei is the expected frequency of category i. This is then compared to what standard deviation they are from one another, if they are far enough away then it is considered significant.

Calculating chi-square using observed and expected frequencies:

1) Find the degrees of freedom for this research question by taking (r-1)(c-1), where r is for the number of rows of data and c is for the number of columns. In this case df = (4-1)(3-1)= 4

2) Find the critical value by going to an online table or a more comprehensive chart with degrees of freedom under “4” and find the closest chi-square value, or, alternatively use online software to calculate the critical value.

3) Calculate chi-square using observed and expected frequencies by using the formula where Oi is observed items in category i, Ei is the expected frequency of category i. This then needs to be compared to what standard deviation they are from one another, if they are far enough away then it is considered significant.

Chi square calculator

Click here to use our T Distribution Table

Non-parametric methods like the chi-square test help researchers with social science data sets due to the fact that the variables can have more than two outcomes. It is a great statistic for categorical variables because it calculates the probabilities of both variables compared to each other and uses this to see how significant they are.

An example used for a chi-square test is comparing smoking habits between men and women using gender as a variable with two possible outcomes:

Male and female. Using a chi-square test, the researcher would look at how many men smoke compared to women, and then see if there’s a correlation between gender and smoking habits, which is what the alternative hypothesis states.

Since technology has advanced with programs such as SPSS making it easier for researchers to calculate data sets.

If you want to round numbers for free click here


Chi-Square Test Of Independence Rule Of Thumb: n > 5

Rules of thumb tend to b used sometimes in statistics. However, it is also important to keep in mind that if there is a rule of thumb, it also means that it may be misleading, misinterpreted, or simply wrong. 

Discover the best online stats calculators.

Chi-square-test

One of the rules of thumb that keeps getting distorted along the way regards the Chi-square test. You probably already heard that “The Chi-Square test is invalid if we have fewer than 5 observations in a cell”. However, this statement is not even accurate. If you are trying to say something similar to this, then you need to say that it’s the expected count that needs to be >5 per cell and not the observed in each cell. 

Remembering The Chi-Square Test

As you probably already know, the Chi-square statistic follows a chi-square distribution asymptotically with df=n-1. This means that you can use the chi-square distribution to calculate an accurate p-value only for large samples. When you are working with small samples, it doesn’t work.

Remembering-The-Chi-Square-Test

The Size Of The Sample

Now, you’re probably wondering about how large the sample needs to be. We can then state that it needs to be large enough that the expected value for each cell is at least 5. 

Understanding the The Chi-Square Goodness Of Fit Test.

The expected values come from the total sample size and the corresponding total frequencies of each row and column. So, if any row or column totals in your contingency table are small, or together are relatively small, you’ll have an expected value that’s too low.

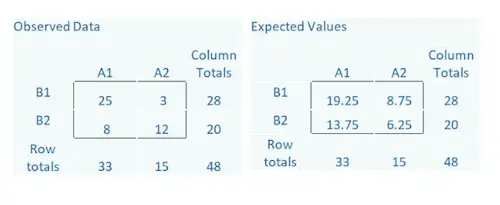
Just take a look at the table below, which shows observed counts between two categorical variables, A and B. The observed counts are the actual data. You can see that out of a total sample size of 48, 28 are in the B1 category and 20 are in the B2 category.

Likewise, 33 are in the A1 category and 15 are in the A2 category. Inside the box are the individual cells, which give the counts for each combination of the two A categories and two B categories.

Take a look at a reliable tool for Chi Square test online.

The-Size-Of-The-Sample

The Expected counts come from the row totals, column totals, and the overall total, 48. 

For example, in the A2, B1 cell, we expect a count of 8.75. It is an easy calculation: (Row Total * Column Total)/Total. So (28*15)/48.

The more different the observed and expected counts are from each other, the larger the chi-square statistic.

Notice in the Observed Data there is a cell with a count of 3. But the expected counts are all >5. If the expected counts are less than 5 then a different test should be used such as the Fisher’s Exact Test.

Check out these 5 steps to calculate sample size.

Is It 5 The Real Minimum?

The truth is that other authors have suggested guidelines as well:

  • All expected counts should be 10 or greater. If < 10, but >=5, Yates’ Correction for continuity should be applied.
  • Fisher’s Exact and Yates Correction are too conservative and propose alternative tests depending on the study design.
  • For tables larger than 2 x 2 “No more than 20% of the expected counts should be less than 5 and all individual expected counts should be greater or equal to 1. Some expected counts can be <5, provided none <1, and 80% of the expected counts should be equal to or greater than 5.
  • The Minitab manual criteria are: If either variable has only 2 or 3 categories, then either:

— all cells must have expected counts of at least 3 or

— all cells must have expected counts of at least 2 and 50% or fewer have expected counts below 5

If both variables have 4 to 6 levels then either:

— all cells have expected counts of at least 2, or

— all cells have expected counts of at least 1 and 50% or fewer cells have expected counts of < 5.


The Chi-Square Goodness Of Fit Test

In case you never heard about the chi-square goodness of fit test before, you need to know that this is the test that should be applied when you have one categorical variable from one single population. The chi-square goodness of fit test is usually used to determine if the sample data is consistent with the distribution that was hypothesized. 

Make sure to try out our free stats tables and calculators.

chi-square-goodness-of-fit-test

Let’s say that some company decided to print some baseball cards. They state that about 30% of their cards are rookies, about 60% of their cards ate veterans but not All-Stars, and about 10% of their cards were veteran All-Stars. 

If you decide to pick a random sample of these baseball cards and you use the chi-square goodness of fit test, you will be able to determine if your sample distribution differed significantly from the distribution that the company said it had. 

When Should You Use The Chi-Square Goodness Of Fit Test

There are some specific situations when you should consider using the chi-square goodness of fit test. These include: 

– When the variable that you want to study is categorical

– When the sampling method that is used is a simple random sampling.

– When the expected value of the number of sample observations in each degree of the variable is at least 5. 

Use our calculator to determine the critical chi-square value.

Conducting The Chi-Square Goodness Of Fit Test

When you want to perform the chi-square goodness of fit test, you need to understand that it requires four different steps:

Step #1: State The Hypothesis

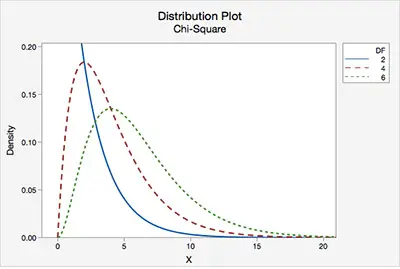
chi-square-goodness-of-fit-test-distribution-plot

When you are conducting a hypothesis test like the chi-square goodness of fit test, you need to have a null hypothesis (Ho) and an alternative hypothesis (Ha). You need to ensure that when you formulate them, they are mutually exclusive. This means that if one of the hypothesis is true, the other hypothesis needs to be false, and vice-versa. 

For a chi-square goodness of fit test, you should use the following hypothesis:

– Ho: The data is consistent with the specified distribution

– Ha: The data isn’t consistent with the specified distribution

Discover a reliable tool for chi square test online.

Step #2: Formulate Your Analysis Plan

During this step, you will need to specify some elements:

– The Significance Level: While most researchers tend to use significance levels of 0.01, 0.05, or 0.10, you can use any value between 0 and 1. 

– The Test Method: You will need to state that you are going to use the chi-square goodness of fit test to determine if the observed sample frequencies differ significantly from the expected frequencies specified within your null hypothesis. 

Step #3: Analyze The Sample Data

conducting-the-chi-square-goodness-of-fit-test

Now, it is time to proceed with the calculations. During this step, you will need to take your sample data and determine:

– The Degrees Of Freedom: This is equal to the number of levels (k) of the categorical variable minus 1

DF = k – 1

Learn how to find the Z score.

– The Expected Frequency Counts: When you look at these for each level of the categorical variable, you will see that these are equal to the sample size times the hypothesized proportion from the null hypothesis

Ei = n*p*i

where,

Ei = expected frequency count for the ith level of the categorical variable

n = total sample size

pi = hypothesized proportion of observations in level i.

– The Test Statistic: This one is defined by the equation:

Χ2 = Σ [ (Oi – Ei)2 / Ei ]

where,

Oi = observed frequency count for the ith level of the categorical variable

Ei = expected frequency count for the ith level of the categorical variable. 

– The P Value: The P value is the probability of observing a sample statistics as extreme as the test statistic. 

Step #4: Interpret The Results

In the case that your sample findings are unlikely, then you will reject the null hypothesis. 


A Reliable Tool For Chi Square Test Online

One of the best statistical tests that you can perform when you want to discover how likely it is to have the observed data fit what you expect is the chi square test online. After all, the chi square test online is simple and effective and allows you to analyze categorical data (data that can be divided into categories).

chi-square-test-online

Take a look at the best statistics calculators.

One of the things that you need to understand about the chi square test online is that it isn’t suited to work with continuous data or percentages.

The Chi Square Test And The Null Hypothesis

One of the things that you need to know when you are making a chi square test is that the null hypothesis always assumes that the variables are independent which is the same as saying that the observed data doesn’t fit the model.

Chi Square Formula And Its Application

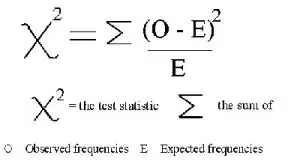
In order to make a chi square test, you need to use its formula. The truth is that it is a fairly simple and intuitive formula:

chi-square-formula

As you can see, you shouldn’t have any problems using it. However, when you have a lot of data, this process can be very tedious. So, we decided to show you a simple example with only a small set of data so that you can easily understand what you need to do to calculate the chi square value.

Let’s say that we want to know more about the relationship between the party affiliations and how they are distributed between males and females.

So, just take into consideration:

The Observed Data

DemocratRepublicanTotal
Male203050
Female302050
Total5050100


The Expected Data

DemocratRepublicanTotal
Male252550
Female252550
Total5050100


So, by using the formula we displayed above, you just need to replace the data that we have on the tables for the respective variables.

X^2 = ((20-25)^2/25) + ((30-25)^2/25) + ((30-25)^2/25) + ((20-25)^2/25)

X^2 = (25/25) + (25/25) + (25/25) + (25/25)

X^2 = 1 + 1 + 1 + 1 = 4

Confirm your results with our chi square value calculator. 

So, you just discovered that the chi square is 4. But what does this mean? What can you conclude?

The truth is that simply looking at the chi square value you can’t conclude much. This is why you need to use the chi square test online which will help you achieve a much more interesting value – the p-value.

In order to calculate the p-value, you need to know the chi square value but you also need to know the degrees of freedom.

The Degrees Of Freedom

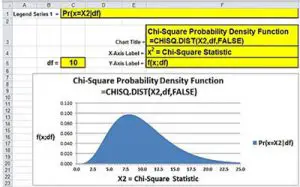
chi-square-value---using-excel

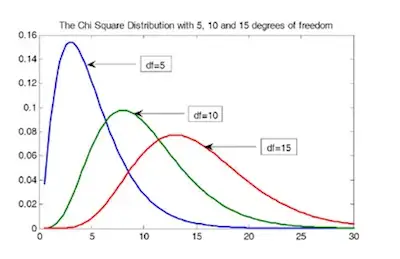
Usually denoted as d or df, the degrees of freedom are able to tell you how many numbers in your table are independent. The degrees of freedom are very important when you are performing a chi square test. After all, they factor the probability of independence into your calculations.

Discover how to find the Z score. 

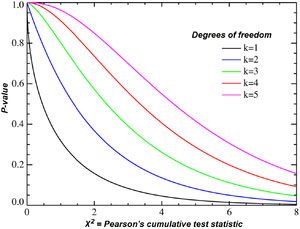
So, after you have the chi square value, you need to take a look at the chart. The degrees of freedom will be expressed on the left. All you need to do is to check the row that has the closest number to the chi square value you got, and then just see the respective number located in the top row. This will give you the “Significance Level” or approximate probability for that value.

Returning to our example, we got a chi square value and a degree of freedom of 1. So, by looking at the table, we can see that we have a p-value of 0.0455. This value means that there is a 4.6% probability of the null hypothesis to be correct.