Understanding: Take An Interaction Out Of A Model
Whenever you are building a model, one of the most important decisions you need to make is related to which interaction terms you should include.
As a rule of thumb, the default in regression is to leave them out. So, this means that you should only add an interaction with a solid reason. If you try to add all possible interactions, it will seem that you are simply data fishing. However, the truth is that this is a very common practice in ANOVA models. Most people simply add all interactions that are possible and only take them out when there is a solid reason.

Discover all the stat calculators you need online.
While we believe that our approach is better, we’re not actually discussing that in this article. Instead, the main goal is to explain what it really means when an interaction is or is not in a model.
Understanding: Take An Interaction Out Of A Model
In order to fully understand, we believe that there’s nothing better than an example.
Imagine that you have a model of the height of a shrub (Height) based on the amount of bacteria in the soil (Bacteria) and whether the shrub is located in partial or full sun (Sun).
While height is measured in cm; bacteria is measured in thousand per ml of soil, and sun = 0 if the plant is in partial sun, and sun = 1 if the plant is in full sun.
Discover how to calculate sample size.
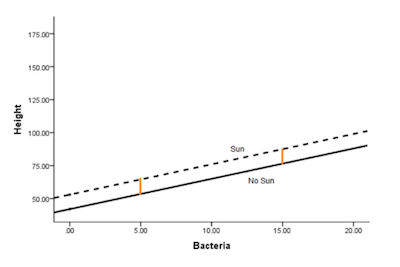
Here’s the model without an interaction term:
Height = 42 + 2.3*Bacteria + 11*Sun
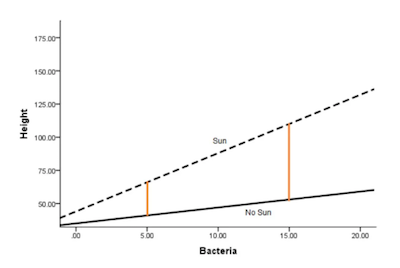
And here is the model with one:
Height = 35 + 1.2*Bacteria + 9*Sun + 3.2*Bacteria*Sun
Understanding mean imputation.
If you take a closer look at the two previous images, you can easily withdraw some conclusions:
1. Adding the interaction allows the effect (slope) of Bacteria to differ in the two Sun conditions.
2. It also allows the effect (mean difference) in the Sun condition (the height of the orange lines) to differ at different values of Bacteria.
3. The interaction coefficient itself (3.2) estimates this difference in effect for one predictor, depending on the value of the other.
If it turns out that the best estimate of the interaction coefficient was zero, not 3.2, then the bottom graph would have looked like the top one.
But there is also a counter-intuitive part.
When you include an interaction in a model, you’re estimating that coefficient from the data. Sometimes the estimate will be zero, or very close to zero, and sometimes not.
When you don’t specify an interaction term, the difference in effects doesn’t just go away. That difference always exists. However, when you don’t specify it, you are simply setting it to zero.
Check out how cloud computing can benefit data science. [ https://statcalculators.com/how-cloud-computing-can-benefit-data-science ]
This is, incidentally, the same issue with removing an intercept from a model, when it theoretically should be zero or is not statistically different from zero.
In the case of the intercept, the general consensus is removing it will lead to unacceptable bias and poor fit. It’s a rare situation where removal is worthwhile.
Technically, the same is true for interactions, but they are generally held to a different standard. Why? The first reason is the fact that interactions are usually more exploratory and the second reason is that they also add more complexity to a model.
As with all issues of model complexity, sometimes the better coefficient estimates and model fit are worth it and sometimes they aren’t. Whether the complexity is worth it depends on the hypotheses, the sample size, and the purpose of the model.