What Is A Partial Correlation?
Correlation isn’t something new to you that are studying statistics. But what about partial correlation?

Let’s take a look at an example so you can fully understand this concept. Imagine that you are trying to lose some weight. So, you will try to change your diet and do exercise at the same time. To ensure that you are covering all aspects, you use an app to keep track of how much you eat and how much exercise you do besides your weight. However, while dieting may be something most people are willing to do, we can’t say the same about exercise. Between the lack of time, not finding a sport you like, lack of motivation, or anything else, you just don’t like to exercise. So, the question that you ask yourself is: if you just change your diet, do you need to exercise as well? Well, to answer this question, you need to use partial correlation, a statistical method.
Looking for the best statistic calculators online?
Partial Correlation
Simply put, a partial correlation is just the correlation between 2 variables when a third variable is held constant.
As we mentioned above, you know that there is a correlation between diet and exercise which is a positive correlation. After all, this means that the better you diet, the more weight you will lose. So, what about the relationship between exercise and weight loss?
As you can easily understand, the relationship between these two variables is negative. While it sounds bad, it really isn’t since the more exercise you do, the more weight you will lose.
Discover the difference between association and correlation.
But what you are trying to get is a complete picture of how both diet and exercise correlate to weight loss. So, in this case, you need to consider the effect exercise has on dieting and weight loss. This is where the partial correlation is useful.

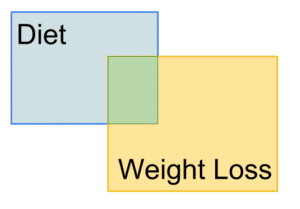
This image shows the relationship between diet and weight loss. The shaded region would be the correlation between these two variables.

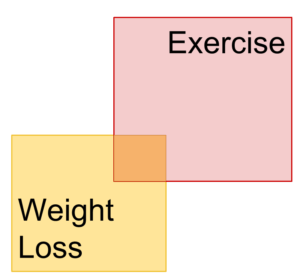
This image shows the relationship between exercise and weight loss. The orange region represents the correlation between the two variables.

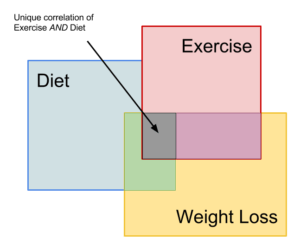
This is the image that represents what you are after. As you can see, the grey region represents the overall correlation between the three variables. The orange and green shaded regions are still there. These indicate the partial correlations that still explain some of the weight loss; however, the grey region is how they both explain what is going on with weight loss.
These are the different types of correlation.
What Do Partial Correlations Do?
As you probably already know, multiple regression is one way to explain patterns in data using multiple variables. However, these aren’t the same as partial correlations. Remember that multiple regression is a way of explaining how individual variables explain relationships. Partial correlations explain how variables work together to explain patterns in the data.
Discover the difference between correlation and linear regression.
The main benefit of using partial correlations is that they allow you to explain patterns in data. For example, in education, there are different types of engagement (cognitive, behavioral, and emotional if you’re interested) that overlap to affect learning. In movies, the amount of romance, action, and comedy in a movie work together to affect box office sales. All of these could be analyzed with partial correlations.
Ultimately, partial correlations are a way to explain patterns in the data using multiple variables. In this case, you look for how multiple variables overlap to explain patterns in the data and come up with a more accurate and reliable model.