Category : Blog

Quantitative Reasoning Questions And Answers – The 4 Different Types

Whenever you think about math or statistics in a general way, you need to understand the difference between qualitative and quantitative reasoning questions and answers.

The truth is that while most people don’t have issues with the qualitative part, most of us do have problems understanding the quantitative reasoning questions and answers.

Make sure to use the top statistics calculators.

Simply put, there are 4 different types of quantitative reasoning questions and answers. Let’s check each one in detail so that you can fully understand them.

#1: Multiple Choice: 1 Answer
quantitative-reasoning-questions-and-answers

The first type, and the simplest one, of quantitative reasoning questions and answers that you have, is the Multiple Choice: 1 Answer. These are simply teh traditional multiple-choice questions that you have seen all over the place.

So, all you need to do is to ensure that the answer that you get is one of the answers that you have to choose from. In case you got a different answer, you need to double-check your options. Sometimes, it is only a matter of having a number written in a different way. For example, a fraction instead of a decimal.

Discover some statistical questions examples. 

#2: Multiple Choice: 1 or More Answers
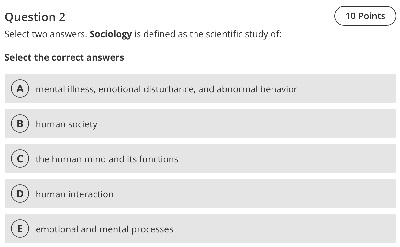
Multiple-Choice--1-or-More-Answers

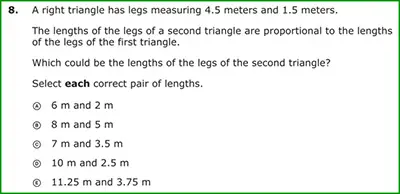
The second type of quantitative reasoning questions and answers that you have is the Multiple Choice: 1 or More Answers. In this type of quantitative reasoning, you will need to find all the correct answers since there may be more than one.

So, you will need to:

  • Check if the test tells you about how many correct answers there are and only choose that exact number of answers.
  • In case the test doesn’t tell you how many answers it has, you can have more than one correct answer.
  • All the different answers can be correct and, in that case, you need to choose them all.
  • You may only have only one correct answer.

Discover the most common probability math problems. 

#3: Quantitative Comparisons
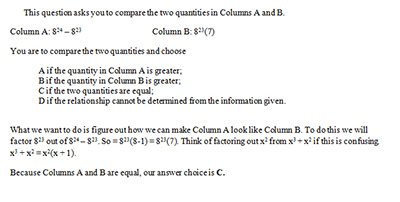
Quantitative-Comparisons

Whenever you have a quantitative comparison, you will need to answer two different questions:

  • How can you compare one value against the other?
  • Does this happen all the time?

In order to solve these type of questions, you should consider that:

  • Sometimes, it is just a matter of rewriting the expression that you have in a different way.
  • Whenever you have variables, you can easily use some integers to help you.
  • When you have conditions such as “if y is not equal to 0”, these are usually a good help to compare the two values.

What exactly is a statistical question?

#4: Numeric Entries
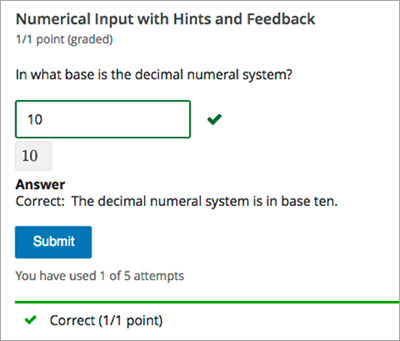
Numeric-Entries

The last type of quantitative reasoning questions and answers is that numeric entries.

The truth is that in this type of questions, you won’t need to choose between different answers. You are only required to type your answer.

In order to make sure that you are able to get to the right answer, you need to carefully read the question that it is asked and understand what exactly you need to find. Then, think about how you can solve the problem and put it into practice. In the end, make sure that you take a closer look at the result and see if it makes sense.
5 Most Helpful Introductory Statistics Books

In case you are wondering about how you can get an introduction to statistics, one of the best options that you have is to read good statistics books. However, with so many different statistics books available, how can you make sure that you are choosing the right one for you?

The reality is that statistics don’t have to be hard. And it really isn’t. It is only a matter of understanding the basics and then move forward to more complicated subjects.

Discover the best statistics calculators.

In order to help you get the basics that you need to understand statistics completely, we would like to suggest you 5 helpful introductory statistics books.

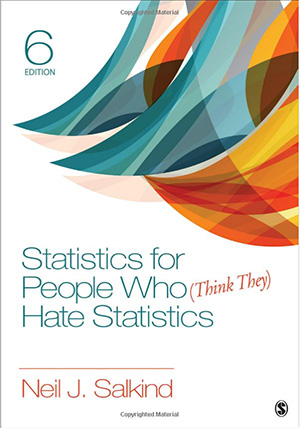
#1: Statistics for People Who (Think They) Hate Statistics 6th Edition by Neil J. Salkind

statistics-books

Click to Check Price on Amazon

The 6h Edition of the Statistics for People Who (Think They) Hate Statistics is already on the market and you can be sure that this s one of the best introductory statistics books that you can even buy.

The truth is that throughout this book, you’ll see statistics explained in an easy-to-understand way, even with some humor. Within the Statistics for People Who (Think They) Hate Statistics, you will learn about correlation, descriptive statistics, analysis of variance, inferential techniques, and graphical representation of data.

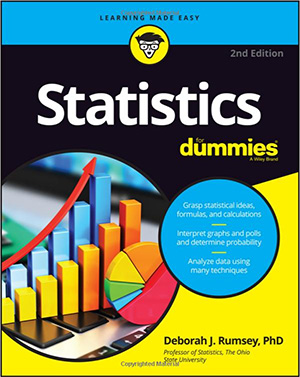
#2: Statistics For Dummies 2nd Edition by Deborah J. Rumsey

2-Statistics-For-Dummies-2nd-Edition

Click to Check Price on Amazon

Whenever you see a book like Statistics For Dummies 2nd Edition you know that it is a light reading. The truth is that this statistic book offers you a practical and clear explanation of the basics of statistics. You will finally be able to get a good grasp of statistical calculations, formulas, and techniques.

One of the things that we really like about the Statistics For Dummies 2nd Edition is the fact that it includes a wide variety of examples to ensure that you keep learning throughout the entire book.

Learn more about the basic statistics for data science.

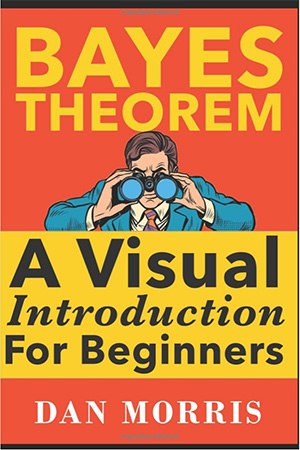
#3: Bayes’ Theorem Examples: A Visual Introduction For Beginners by Dan Morris

3-Bayes-Theorem-Examples-A-Visual-Introduction-For-Beginners

Click to Check Price on Amazon

While statistics is a very wide field, the truth is that a lot of people has some issues with the Bayes Theorem. If this is your case, the Bayes’ Theorem Examples: A Visual Introduction For Beginners is the perfect choice for you.

The reality is that the Bayes Theorem is very important when you need to deal with uncertainty. And this is also what tends to be more difficult for people to understand. However, with the Bayes’ Theorem Examples: A Visual Introduction For Beginners, you will understand each problem that you need to solve. After all, this statistics book is filled with a lot of hand-drawn visuals to ensure that you are on the right path.

With the Bayes’ Theorem Examples: A Visual Introduction For Beginners, you will also get a better perspective of the way that many researchers keep using this theorem nowadays.

Take a look at the best statistic books for data science.

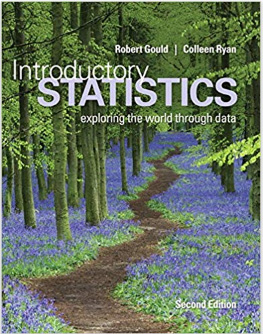
#4: Introductory Statistics (2nd Edition) by Robert Gould, Colleen N. Ryan

4-Introductory-Statistics-(2nd-Edition)

Click to Check Price on Amazon

Written by Robert Gould and Colleen Ryan, the Introductory Statistics (2nd Edition) is one of the best statistics books to learn how to access and analyze the data today.

The Introductory Statistics (2nd Edition) was written with statistics students in mind and this is why you can expect a simple and clear text that is easily understandable.

Need help to understand statistical questions?

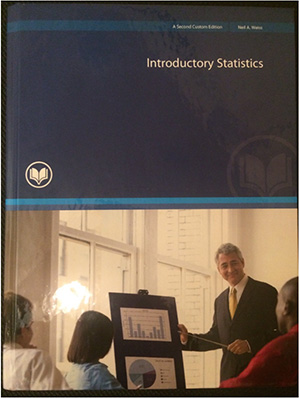
#5: Introductory Statistics by Neil A. Weiss

5-Introductory-Statistics

Click to Check Price on Amazon

If you really like the statistics field and want to ensure that you get the best of statistics books, you should definitely consider getting the Introductory Statistics.

Written by Neil A. Weiss, the Introductory Statistics is a great book that is written in a clear way so that everyone can understand. The truth is that this book is a lot more than just an introduction to statistics. Nevertheless, the ability of the author to write allows you to dominate even some complex topics.


Learn How To Calculate P Value From Z By Hand

While there are many online calculators that show you how to calculate p value from z, the truth is that it is important to understand how to make this calculation by hand.

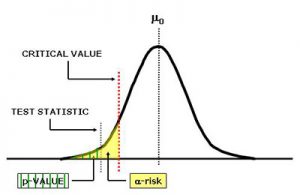
Before we actually start with the explanation about how to calculate p value from z, it is important that you know that when you are testing a hypothesis about a specific population, you can and should use the test statistic to decide if you will reject the null hypothesis, H0. And this can be made when you already know the p value.

Make sure to check the best free statistic calculators online.

The p value is always a probability and it is linked to your critical value. On the other hand, this critical value depends on the probability of a Type I error to occur. So, what we are saying is that it measures the probability of achieving results that are at least as strong as yours if the null hypothesis (H0) is true.

how-to-calculate-p-value-from-z

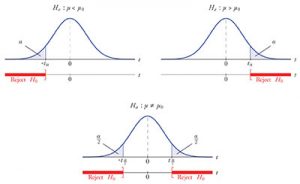
It is important to notice that in case the alternative hypothesis is the less-than alternative, in this case, you will only be able to reject the null hypothesis (H0) if your test statistic hits the left side of the distribution.

So, how to calculate p value from z?

The first thing you need to do to calculate the p value from z is to check your test statistic on the appropriate distribution – on the Z-table.

Check our Z score table. 

Now, looking at the Z-table, you will need to find the probability of where Z is more extreme than your test statistic. You will then be able to take one of the three possible conclusions:

#1: When Ha Contains A Less-Than Alternative:

critical-value-and-test-statistic

You will need to determine the probability that Z is less than your test statistic. As a side note, it is important to mention that this test statistic is usually negative.

#2: When Ha Contains A Greater-Than Alternative:

You will need to determine the probability that Z is greater than your test statistic. So, you’ll need to search for the value in the Z-table and then subtract it from one. As a side note, it is important to mention that this test statistic is usually positive.

Learn how to find Z score for a normally distributed data.

#3: When Ha Contains A Non-Equal-To Alternative:

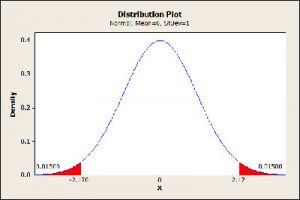
distribution-plot-example

In this case, you will need to find the probability that Z is not only beyond your test statistic as you will need to double it. When this situation occurs, there can be two different scenarios:

– When your test statistic is positive, you will need to first check the test statistic on the Z-table where the Z probability is greater than your test statistic, and subtract it from one and, only then, you will double the result to get the p value.

– When your test statistic is negative,  you will need to first check the test statistic on the Z-table where the Z probability is less than your test statistic and you will double it to get the p value.


Basic Statistics For Data Science You Need To Know

With more and more people aspiring to become Data Scientists, it is important to determine which are the basic statistics for data science.

One of the things that you need to bear in mind is that even though you don’t need to be the top expert in the statistics field, you need to have a good knowledge about it. Specifically the basic statistics for data science.

Looking for statistics calculators?

While math plays a crucial role in the field, statistics is even more important for any Data Scientist. So, you need to make sure that you have a good knowledge of the most important basic statistics for data science.

So, here are the basic statistics for data science that you need to know and understand:

#1: Statistical Distributions

Statistical distributions are very important for data scientists. Even though there are different statistical distributions that you need to know and understand, two of the most important ones are:

  • Poisson Distribution

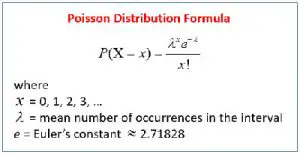
basic-statistics-for-data-science

As one of the most important distributions in statistics, it is very important that you understand the Poisson distribution.

This distribution is usually used to determine the number of events that are likely to occur in a specific time interval. One practical example of how this distribution is used in the real life is when it is used to determine the loss in manufacturing.

Discover everything you need to know about the ANOVA F value. 

  • Binomial Distribution

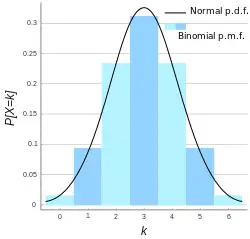
Binomial-Distribution

One if the things that you need to know about binomial distributions is that they can only be used for discrete values. Nevertheless, this is the type of distribution that keeps being used in statistics and that should help you with data science as well. In addition, most binomial distributions can be represented using a chart like the one that you see above. As you can easily see, the shape of this chart is very similar to the typical normal distribution curve.

The list of important distributions goes on and on. While these two are crucial, there are others that you should consider taking a deeper look  at as well:

  • Discrete Uniform Distribution
  • Geometric Distribution
  • Negative Binomial Distribution
  • Hypergeometric Distribution

Take a look at a practical insight of an F test. 

#2: Theorems And Algorithms

When we are talking about the basic statistics for data science, we can’t forget about important theorems and algorithms. From the simplest ones to the most complex, there are a lot of theorems and algorithms in the statistics world. However, since we are only looking at the basic statistics for data science, here are the most important ones:

  • Bayes Theorem

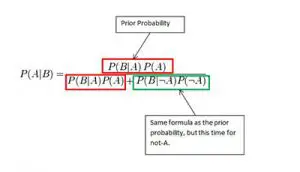
Bayes-Theorem

This theorem is one of the most well-known statistical theorems. Simply put, this theorem simplifies very complex concepts by using just a couple of variables. The “conditional probability” is supported by the Bayes Theorem and it tells you that by solely using the given data points, you will be able to determine or predict the probability of any hypothesis.

  • ROC Curve Analysis

ROC-Curve-Analysis

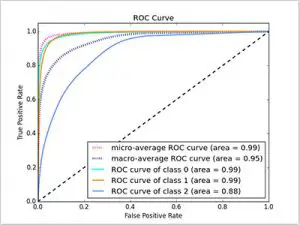
In case you don’t know, ROC stands for Receiver Operating Characteristic and it is very used in Data Science.

One of the best applications of the ROC Curve Analysis is in predicting how well a test will perform by measuring its fall-out rate versus its overall sensitivity. So, as you can imagine, this analysis is crucial to determine the viability of any model.


The Top 3 Best Statistic Books For Data Science

We have no questions that you absolutely need a good knowledge about statistics to be good at data science. Even though there are some new Data Scientists who don’t agree with us, we stand up with what we believe.

The truth is that while stats have been mostly used to test the different hypothesis, the reality is that stats are also being used to formulate new hypothesis.

Here you can find all the stat tables you need.

So, the best place to gather a good knowledge about this is by reading the best statistics book for data science.

The truth is that we tried hard to be able to tell you about only the best statistics book for data science. However, we couldn’t limit our choice to just one. So, we are about to show you the 3 best statistics books for data science:

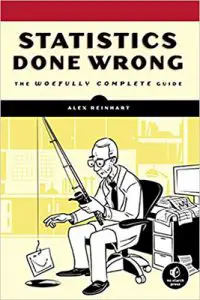
#1: Statistics Done Wrong: The Woefully Complete Guide by Alex Reinhart

best-statistics-book-for-data-science

One of the things that you may not be aware of if that statistical analysis is not a simple thing to do. In fact, there are scientists that aren’t doing it the right way.

So, within the Statistics Done Wrong: The Woefully Complete Guide, you are going to be able to see those omissions and errors in some of the most recent research as well as you will discover some of the misconceptions that may lead you in the wrong direction. This way, you’ll know exactly what to watch out for and prevent these same errors from happening to you. 

Alex Reinhart, the author of the book, will also tell you more about the analytical software that can help you.

Discover the basic statistics formulas that you need to understand.

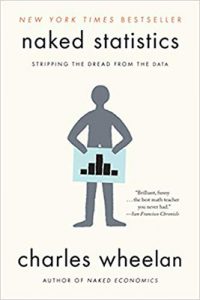
#2: Naked Statistics: Stripping the Dread from the Data by Charles Wheelan

Naked Statistics-Stripping the Dread from the Data

While many people still consider statistics boring, the truth is that its application is growing every day. Just think about how you can possibly answer the following questions:

  • Why is there a recent rising in autism?
  • How does Netflix evaluates which movies you are likely to like more?
  • How can we prevent schools from cheating on standardized tests?

The answer to all these questions is based on statistics and you’ll see how you can use the different statistical tools to do it within the Naked Statistics: Stripping the Dread from the Data by Charles Wheelan.

From the clarification of key concepts such as regression analysis, correlation, and inference, you will also learn how the best researchers are using valuable data to try to answer complicated questions.

Discover the top sources of data in statistics. 

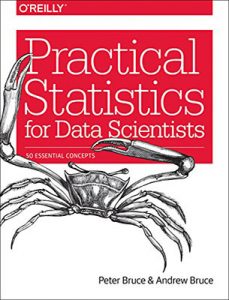
#3: Practical Statistics for Data Scientists: 50 Essential Concepts by Peter Bruce and Andrew Bruce

Practical-Statistics-for-Data-Scientists-50-Essential-Concepts

Where you are interested in getting a deeper look at data science, the Practical Statistics for Data Scientists: 50 Essential Concepts by Peter Bruce and Andrew Bruce is one of the best statistics books that can help you.

The truth is that even though there are many books related to statistics, there are only a few that cover its application to data science. So, this book is a can be a real asset.

The Practical Statistics for Data Scientists: 50 Essential Concepts by Peter Bruce and Andrew Bruce is a practical guide that will show you about what is important and what is not, will teach you about how to apply the different statistical methods to data science, among many more. 


Understanding Statistical Questions – Statistical Questions Examples

One of the basic concepts that you need to understand where you are dealing with statistics is that you are basically studying variability. The reality is that when you ask a question, the answer will be given by data that varies. And this is when it is important to make the clear distinction between statistical questions and non-statistical questions.

statistical-questions-examples

Simply put, a statistical question can only be answered when you collect data that varies. While we understand that some people may not have any problems understanding the concept, the truth is that it is always better to present examples. So, we decided to show you a couple of statistical questions examples so that you can fully understand the difference between statistical questions and non-statistical questions.

Discover the best free statistics calculators.

Let’s take a look at the following questions and see which ones are statistical questions examples and which ones are non-statistical questions examples.

#1: How old is your dog?

statistics-world

This is a non-statistical question. Why? The question can be answered by a single number and by collecting data that will vary.

#2: How many days are in March?

Again, this is a non-statistical question. The number of days that a month has doesn’t vary throughout time. In addition, all you need to do is to count the days that March has to get the answer.


#3: How many bricks are in this wall?

This is another question that is clearly non-statistical. After all, it is asking how many bricks a particular wall has and all you need to do is to count the number of bricks that it includes. The answer to the question is a single number and you won’t answer the question by collecting data that varies.

#4: What is the proportion of students at your school that like watermelons?

looking-at-statistics

This is the first statistical question example that we have so far. In order to discover the proportion of the students who like watermelon at your school, you need to collect data first. And this data will vary since there will be students who like watermelon and others who hate it.

Take a look at a reliable tool for chi square test online.

#5: Do you like watermelons?

A similar question to the previous one but, in this case, is a non-statistical question. The truth is that you either like or dislike watermelons. It is a single answer that won’t involve the collection of data.

#6: What was the temperature at noon today at City Hall?

This question can cause some doubts. However, you just need to look at how it is formulated so that you can discover if this is one of the statistical questions examples or not.

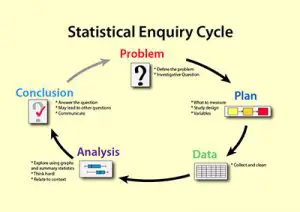
statistical-enquiry-cycle

If you take a closer look at the question, it is asking the exact temperature at a specific time, in a specific place. So, there is no variability in the results and you don’t need to do any data collection. However, if the question was “what will the temperature be at noon at City Hall tomorrow?”, this was already a statistical question. After all, you needed to collect data that would vary depending on the previous temperatures, humidity, among others.

#7: On average, how old are the dogs that live on this street?

This is another statistical question example. In order to answer this question, you will need to collect the data and the data will vary. Not all dogs are the same age.


What Is A Statistical Question?

In case you never noticed, we keep labeling everything when we are talking about math. Just think about it. Consider the number 1, for example. What can you say about it? The number 1 is a positive number, is a whole number, is an integer, among a lot of other things. And the same happens when you look at a function too. So, it is normal that when you look at questions, that they have their own labels as well. And this is where the question what is a statistical question arises.

Take a look at the best statistics calculators.

So, what is a statistical question?

what-is-a-statistical-question

Simply put, a statistical question is a question that you make that you know, beforehand, that it won’t have one single answer. The truth is that when you ask a statistical question, you should expect to get a wide variety of answers. So, your final answer will depend on the tendency and distribution of the different answers that you got.

In case you need a more practical example to understand the difference between a statistical question and a non-statistical question, just take these questions:

  • How tall are you? – this is a non-statistical question since you expect to get only one single answer.
  • How tall ate the students in your college? – this is a statistical question.

Another thing that is common in statistical questions is that the answer will depend on the situation. How? Let’s find out.

learn-about-statistics

Here are two simple statistical questions:

#1: How much water do people need to drink to stay hydrated?

While we all know that we need to drink water to remain hydrated, the amount of water that each one of us needs to drink depends on a wide range of factors. From your age to your height, the weight, among so many more. So, our answer to this statistical answer would be that each person needs to drink between 6 and 8 cups of water every day.


#2: How fast do cheetahs usually run?

The answer to this statistical question will also need to be put in a range. After all, even though we all know that cheetahs can run incredibly fast, some are faster than others. Just think about the differences between genres or the age of the cheetahs, for example. So, we can then only say that cheetahs can run about 70 miles per hour.

Discover our correlation coefficient calculator.

So, how can you say, without any doubt, if a question is statistical or non-statistical?

The truth is that in order for a question to be considered as a statistical question, it needs to meet 4 criteria or requirements:

#1: Specific Topic Or Focus:

In order for a question to be considered a statistical question, it needs to contain a specific topic.

#2: Population:

statistical-vs-non-statistical-questions

We can simply define population as the specific group of individuals to whom the statistical question is going to be asked.

Learn more about mean median, mode, and range. 

#3: Specific Number Of Options:

In order for a question to be considered statistical, it needs to have a specific number of options to choose from – they should be between 5 and 10.

#4: Specific Options:

The last factor that needs to be taken into account for a question to be statistical is that it needs to have numerical results. After all, these can be easily shown in a graph as well as interpreted and identified.


An Overview Of The Most Common Probability Math Problems

While you may look at probability math problems and don’t see any practical examples of them in the real life, this isn’t quite true. The truth is that this is one of the areas of math where you can really apply it to the real life.

Answering questions about your chances to get into a specific college or university, for example, can be answered using probabilities.

Get the help you need with our free statistical calculators.

probability-math-problems

Before we show you some practical probability math problems, it’s important that you know that in math, probability is the likelihood of a certain event to occur. So, we can also say that we can have 3 possible solutions:

  • either the vent will happen for sure, meaning that the probability is 1;
  • the event won’t ever happen, meaning that the probability is 0;
  • the even may occur sometimes, meaning that the probability is between 0 and 1.

So, based on these assumptions, you can never have a negative probability value.

The basic formula of probability is as follows:

P(A)  = ( Number of ways A can occur ) / ( Total number of possible outcomes )

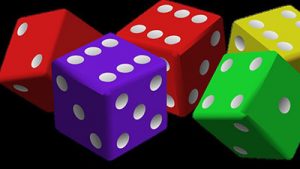
Example: Let’s say that you want to roll a die and you want to know the probability of rolling a 3.

You know that the number of ways it can occur is 1 and that there are 6 different possible outcomes. After all, you can roll the dice and get 1, 2, 3, 4, 5 or 6.

So, P = 1/6

Discover some basic statistics and probability formulas.

rolling-die

However, not all probability math problems are so simple. Most of the times, you want to discover the probability of the occurrence of more than one outcome. This is called the compound probability and its formula is as follows:

P(A or B) = P(A) + P(B) – P(A and B)

where,

  • both A and B are two different events.
  • P(A or B) refers to the probability of the occurrence of at least one of these events.
  • P(A and B) refers to the probability of the occurrence of both A and B at the same time.

In addition, you can also have mutually exclusive events. But what does this mean exactly?

Simply put, mutually exclusive events are the events where only one of them will occur. So, when you have mutually exclusive events, P(A and B) = 0.

Looking for more complicated probability math problems? Use out Binomial probability calculator.  [ https://statcalculators.com/binomial-probability-calculator/ ]

Example: Let’s say that you want to know the probability of rolling a 1 or a 4 when you roll a die.

If we were talking about individual probabilities, you would have the same probability for both events: P = 1/6. However, you want to discover the compound probability.

deck-of-cards

So, by using the formula:

P(2 or 5) = P(2) + P(5) – P(2 and 5) = 1/6 + 1/6 – 0 = 2/6 = 1/3

Independent And Dependent Events

In probabilities, you can have either independent events or dependent events.

#1: Independent Events:

You have an independent event when multiple events occur and the outcome of an event doesn’t affect the outcome of the other events.

#2: Dependent Events:

You have a dependent event when two events occur and the outcome of one of them affects the other.

While when you roll a die, you will always have independent events no matter the probability that you want to calculate, when you are playing with cards and you want to know the probability of getting a specific one, can either be an independent or a dependent event. This all depends on whether there is a replacement of the card to the deck or not.


Basic Statistics Formulas You Need To Understand

When you are studying statistics, you need to know that there are a lot of different formulas that you need not only to know but also to understand. So, we decided to gather here the basic statistics formulas that you should definitely understand. After all, they are the base of everything that you can do related to statistics but also related to probabilities.

Discover the best statistical calculators online that can give you a hand. 

Our main goal to show you these basic statistic formulas it to allow you to model, analyze, and test different statistical experiments and surveys.

While you probably already heard about most of the probability and statistics formulas we are about to mention, it’s also important to remember them and put them into context.

Here are some of the basic statistic formulas you need to understand:

#1: Population Mean:

basic-statistics-formulas

Where,

μ – population mean

Σ Xi – sum of all scores that are present in the population

N – the total number of cases or individuals in the population

The population mean is simply the average score of the population on a given variable.

#2: Population Standard Deviation

probability-and-statistics-formulas

Where,

σ – population standard deviation

sqrt – square root

Σ ( Xi – μ )2 – sum of the squared deviations of the scores from the population mean

The population standard deviation allows you to measure the variability or spread of the scores on a specific variable.

#3: Population Variance:

Population-Variance

The population variance is the square of the standard deviation of the population.

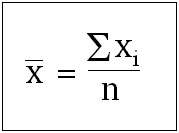
#4: Sample Mean:

sample-mean

where,

Xi – are the scores of the sample

n – the total number of observations in the sample

The sample mean is the average of the sample on a given variable.

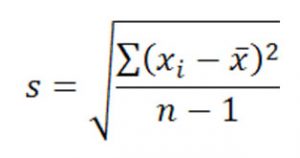
#5: Sample Standard Deviation:

Sample-Standard-Deviation

where,

Xi – the scores of the sample

X_bar – sample mean

n – the total number of observations in the sample

The sample standard deviation is a measure of the spread or variability of the scores in the sample that you are analyzing, for each given variable.

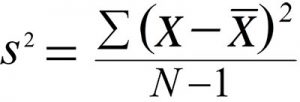
#6: Sample Variance:

Sample-Variance

Simply put, the sample variance is the square of the sample standard deviation.

#7: Chi Squared Test:

Chi-Squared-Test

Where,

Oi – observed frequencies

Ei – expected frequencies

You can either calculate the chi square value by hand or you can use our free Critical Chi Square Value Calculator. 

#8: Standard Or Z-Score:

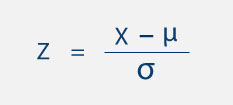
Standard-Or-Z-Score

Where,

X – member element of the group

μ – mean of expectation

σ – standard deviation

#9: Covariance Of X & Y:

Covariance-Of-X-&-Y

Cov(X,Y) – covariance between the X and Y variables

x – member of the X variable

y – member of the Y variable

x_bar – mean of the X variable

y_bar – mean of the Y variable

n – number of members


And here are some of the probability formulas you also need to understand:

#1: Probability Of An Event A:

Probability-Of-An-Event

The probability of an event tells you how likely it is for it to happen.

Check out our binomial probability calculator. 

When you have two different events A and B:

P(A) = n(A) / n

P(B) = n(B) / n

1-probability

When you are dealing with mutually exclusive events, then:

2-mutually-exclusive-events

When you are dealing with non-mutual events, then,

3-non-mutual-events

For conditional probability:

4-conditional-probability

While there are many more probability and statistics formulas, the truth is that we just showed you the most basic statistics formulas and probability formulas that you need to know about. As you get to know more concepts, you can then move to more complicated statistics terms and formulas as well as to other tests and models. Nevertheless, we believe that these are now enough for you to get a grasp of statistics and probabilities formulas.


The Top Sources Of Data In Statistics

In statistics, you need to collect the figures and facts that can be numerically measured. Data, simply put, is the collection of observations that you gather that has the same characteristics.

sources-of-data-in-statistics

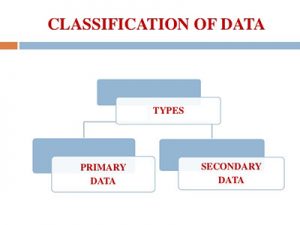
The data that you collect may be either primary data or secondary data and it can be gathered by organizations using experiments or surveys, or by individual workers. So, as you will see, there are different sources of data in statistics.

Discover the best stats calculators.

The main difference between primary and secondary data is related to the way that the data itself is gathered.

#1: Primary Data In Statistics:

Primary data is always collected wither by an individual or by an organization. This data can be gathered using different instruments including conducting interviews, focus groups, questionnaires, surveys, and experiments. We can then say that primary data is, in fact, raw data. After all, it is only collected directly and hasn’t been subjected to any statistical treatment.

collecting-data

Discover what range means in math. 

Here are the main sources of data in statistics:

  • Through Investigators:

Investigators are highly trained people whose job is to collect the data that is necessary. When doing surveys, for example, investigators will need to contact individuals and ask them to answer their questionnaires. Each one of these questionnaires should have a number of stipulated responses that should be given by the individuals. While this method can take a lot of time and be costly, there are still many organizations that adopt it because it is able to deliver good results.

  • Through Personal Investigation:

This source of data in statistics is very similar to the one we just mentioned before. However, it has a limitation in case the personal investigator needs to collect a huge amount of data. After all, this will take the researcher a lot of time to get all the data he needs and he may not have the means to do all the necessary calculations.

  • Through Internet:

If you are used to be online, you probably already saw adds where you can be paid for answering surveys. While not all these websites are trustworthy, this form of data collection is worth to be mentioned. After all, this is one of the main tools Google uses to collect pertinent information.

  • Through Local Sources:

You probably already got some phone calls asking you to fill out a survey or a questionnaire. It can be related to a wide range of subjects. This type of data is usually one of the easiest and fastest kinds of data to obtain.

statistical-data

  • Through Questionnaire:

A questionnaire is just a set of questions that needs to be sent out by mail (or downloaded) to the previously selected individuals. While this method is one of the most affordable ones, many people decline to answer and never mail back their questionnaire to the investigator.

Discover everything you need to know about standard deviation in statistics.

#2: Secondary Data In Statistics:

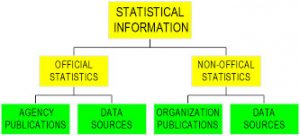
Secondary data in statistics is the type of data that is immediately available to be gathered. There is no need to ask questions to have the answers. Secondary data is available to the general public through newspapers, journals, and publications.

This kind of data may have undergone some kind of statistical treatment and can be tabulated or sorted.

Here are the sources of data in statistics:

  • Research journals and newspapers
  • Government Organizations such as the Census and Registration Organization, the Crop Reporting Service-Agriculture Department, the Federal and Provincial Bureau of Statistics, among many others.
  • Teaching and research organizations
  • Semi-Government organizations such as financial and commercial institutions, district councils, municipal committees, among others
  • Internet