Category : Descriptive Statistics

Descriptive Vs. Inferential Statistics

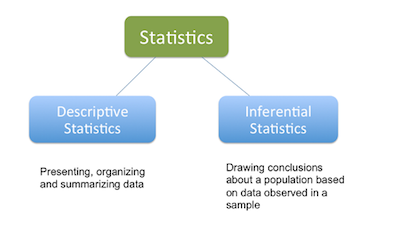
One of the first things that you study when you begin learning statistics is the descriptive vs inferential statistics difference. 

Discover the statistics calculators you need.
descriptive-vs-inferential-statistics

The reality is that when you are analyzing data such as the marks achieved by 100 students for a piece of coursework, it is possible to use both descriptive and inferential statistics in your analysis of their marks. But what is descriptive statistics, inferential statistics, and the differences and similarities between the two?

Descriptive Statistics
Descriptive-Statistics

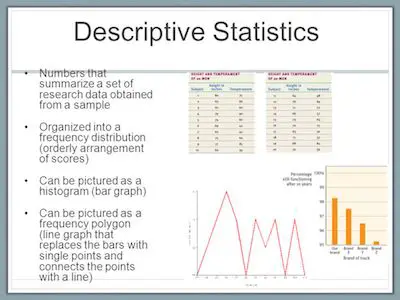
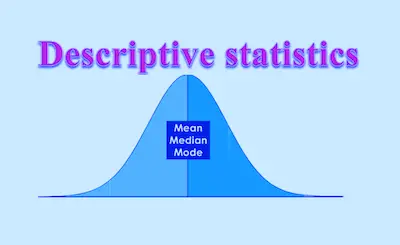
Simply put, descriptive statistics is the analysis of data that helps describe, summarize, or show data in a meaningful way. This way, you can see patterns emerging from the data itself. However, unlike what you may thing, descriptive statistics doesn’t allow you to draw any conclusions beyond the data that you analyzed or reach conclusions regarding any hypotheses you might have made. 

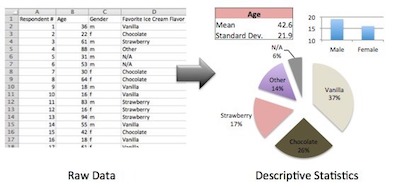
Notice that this doesn’t make descriptive statistics less important. In fact, descriptive statistics is important because if you simply presented your raw data, it would be hard to visualize what the data was showing, especially if there was a lot of it. 

Learn more about confidence intervals.

For example, if you had the results of 100 pieces of students’ coursework, you may be interested in the overall performance of those students. You would also be interested in the distribution or spread of the marks. And this is exactly what descriptive statistics shows you. 

Typically, there are two general types of statistic that are used to describe data:

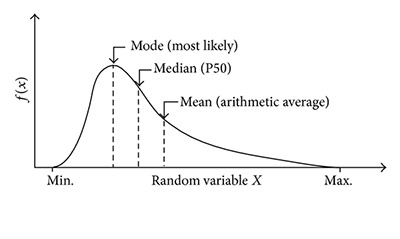
  • Measures of central tendency: these are ways of describing the central position of a frequency distribution for a group of data. You can describe this central position using a number of statistics, including the mode, median, and mean. 
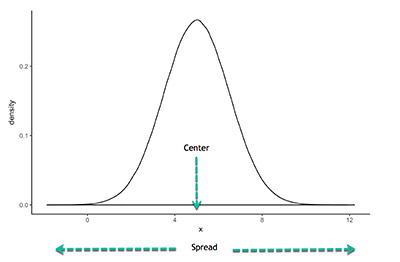
  • Measures of spread: these are ways of summarizing a group of data by describing how spread out the scores are. To describe this spread, a number of statistics are available to us, including the range, quartiles, absolute deviation, variance and standard deviation.

Discover how to interpret the F-test.

Inferential Statistics
Inferential-Statistics

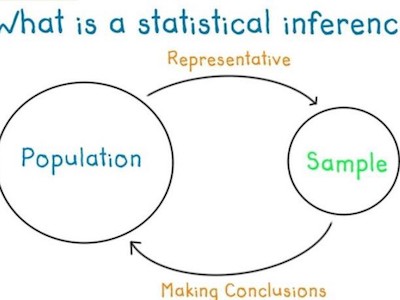
As we just saw above, descriptive analysis allows you to look at a group or part of a population’s data. You can then use different statistics to reach some conclusions. However, in the real world, it is almost impossible to access the whole population data that you are interested in investigating. Therefore, you are limited to a group which means that you will need to use a sample of the population that can represent that same population. 

We can then say that inferential statistics are techniques that allow you to use these samples to make generalizations about the populations from which the samples were drawn. The process of achieving this is called sampling. Inferential statistics arise out of the fact that sampling naturally incurs sampling error and thus a sample is not expected to perfectly represent the population. The methods of inferential statistics are the estimation of parameter(s) and testing of statistical hypotheses.


Looking to know why adding values on a scale can lead to measurement error?

Descriptive Vs. Inferential Statistics – Bottom Line
Descriptive-Vs.-Inferential-Statistics-Bottom-Line

Overall speaking, it is understandable that descriptive statistics are limited. This means that you can only make conclusions about the population that you actually measured. 

In the case of inferential statistics, we need to mention that they have 2 limitations. The first one which is also the most important one is the fact that you are providing data about a population that you have not fully measured, and therefore, cannot ever be completely sure that the values/statistics you calculate are correct. The second limitation is the fact that inferential statistics requires the researcher to make educated guesses to run the tests. 
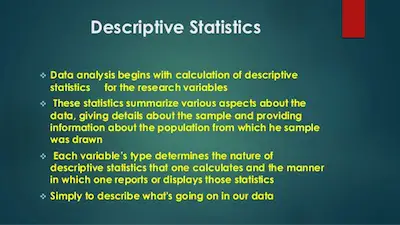

How To Use Descriptive Analysis In Research

Before we get into how to use descriptive analysis in research, we believe that it is important to define what descriptive analysis is in the first place. 

What Is Descriptive Analysis?

Simply put, descriptive analysis is one of the two main types of statistical analysis and it can be defined as the brief descriptive coefficients that summarize a specific data set which can be either a representation of the entire or a sample of a population. 

descriptive-analysis-in-research

Learn everything you need to know about statistics.

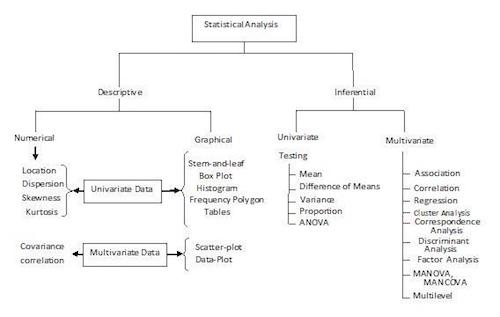
One of the things that you should keep in mind about descriptive analysis is that it can be broken down into measures of central tendency and measures of variability (spread). In case you don’t remember, the measures of central tendency include the mean, median, and mode, while the measures of variability include the standard deviation, variance, the minimum and maximum variables, and the kurtosis and skewness.

Understanding Descriptive Analysis

Understanding-Descriptive-Analysis

Overall, descriptive analysis helps describe and understand the features of a specific data set giving short summaries about the sample and measures of the data. 

As we already mentioned above, the most known or recognized types of descriptive statistics are measures of center: the mean, median, and mode, which are used at almost all levels of math and statistics. 

The mean which is the average is calculated by adding all the figures within the data set and then dividing by the number of figures within the set. 

Let’s say that you have the following data set: 2, 3, 4, 5, 6. 

So, the mean is 4 ((2 + 3 + 4 + 5 + 6)/5). 

The mode of the data set is the value that appears more often. And the median is the value that appears in the middle of the data set when the values are ordered from the smallest to the largest. 

Discover how you should use the student’s t test.

One of the most interesting facts about descriptive analysis is that it is mainly used to repurpose hard-to-understand quantitative insights across a large data set into bite-sized descriptions. 

Let’s take the GPA (grade point average) as an example. Simply put, this provides a good understanding of descriptive statistics. After all, the idea of a GPA is that it takes data points from a wide range of grades, classes, exams, and averages them together to provide a better understanding of a student’s overall academic capabilities. So, ultimately, a student’s personal GPA simply refers to the student’s mean academic performance. 

These are the degrees of freedom for t tests.

Measures Of Descriptive Analysis In Research

Measures-Of-Descriptive-Analysis-In-Research

As we already mentioned, descriptive statistics are either measures of central tendency or measures of variability which are also known as measures of dispersion. 

While the measures of central tendency focus on the average or middle values of data sets, the measures of variability focus on the dispersion of data. These two measures use graphs, tables, and general discussions to help people understand the meaning of the analyzed data.

Measures of central tendency describe the center position of a distribution for a data set. A person analyzes the frequency of each data point in the distribution and describes it using the mean, median, or mode, which measures the most common patterns of the analyzed data set.

Take a look at the advantages and disadvantages of measures of central tendency. 

In what concerns the measures of variability, they aid in analyzing how spread-out the distribution is for a set of data. For example, while the measures of central tendency may give a person the average of a data set, it does not describe how the data is distributed within the set. So, while the average of the data may be 65 out of 100, there can still be data points at both 1 and 100. Measures of variability help communicate this by describing the shape and spread of the data set. Range, quartiles, absolute deviation, and variance are all examples of measures of variability. 


Types Of Statistical Analysis

One of the things that many people don’t know is that statistics is used in many different areas. Some of them may not even come to your mind when you think about it. Some examples include data analysis, financial analysis, business intelligence, market research, and many more. But why does this matter? Why is this important?

types-of-statistical-analysis

The truth is that statistics is the basis for many business decisions every single day. However, statistical analysis can be divided into two main types of statistical analysis – descriptive and inferential. 

Types Of Statistical Analysis

When you are analyzing information in the real world, you can use both descriptive as well as inferential statistics. The reality is that in many research done on groups of people like marketing research, for example, you can use both types of statistical analysis not only to analyze results but also to come up with conclusions. So, let’s check each type in more detail.

Check our our standard error calculator. 

#1: Descriptive Statistics:

Descriptive-Statistics

Simply put, descriptive statistics is mainly used to describe the basic features of information and then show or summarizes all the data in a rational way. So we can then state that descriptive statistics studies quantities. 

Notice that descriptive statistics uses the data from a specific population or a sample of it. As you already know, the population is a group. So, it can include numbers, tables, charts, graphs, and present raw data. 

One of the main aspects to keep in mind about descriptive statistics is that it doesn’t make any conclusions. The reality is that you’re not able to get conclusions as well as you won’t also be able to make generalizations beyond the data that you are considering. So, simply put, within the descriptive analysis, you can only describe what is and what the data shows. 

Looking to determine the standard error?

Here’s an example. Imagine a population of 30 workers in a business department. And at this point, you want to discover the average of that data set for 30 workers. However, you can’t discover what the eventual average is for all the workers in the whole company using just that data. Imagine, this company has 10 000 workers.

Despite that, this type of statistics is very important because it allows us to show data in a meaningful way. It also can give us the ability to make a simple interpretation of the data.

In addition, it helps us to simplify large amounts of data in a reasonable way.

Make sure to learn more about the standard error.

#2: Inferential Statistics:

Inferential-Statistics

Inferential statistics is a bit more complicated than descriptive statistics. Simply put, inferential analysis allows you to infer trends about a larger population based on samples of subjects taken from it. 

So, as you can easily understand, this type of analysis allows you to study the relationships between variables within a sample, you can make conclusions, generalizations, and even predictions about a bigger population. 

One of the main advantages of using inferential analysis is the fact that it allows organizations and businesses to test a hypothesis and come up with conclusions about the data they have in hand. And this is quite helpful since in most cases, it is too expensive to study the entire population of people or objects. 


The Ultimate Guide To Descriptive Statistics

Simply put, descriptive statistics is a way that you have to summarize and organize the data that you collect. This way, it will be easier to understand it. 

Descriptive-Statistics

A lot of people tend to use descriptive statistics and inferential statistics in the same way. However, the two concepts are different. When you use descriptive statistics, you are looking for a way to describe the data but you aren’t trying to make any kind of inferences from the sample that you are looking at to the whole population. 

The best statistical calculators are available here.

The Different Types Of Descriptive Statistics

Overall, we can easily divide descriptive statistics into two different categories:

#1: Measures Of Central Tendency:

Measures-Of-Central-Tendency

Within this descriptive statistics category, you can assume that there is a number that is central to the set or that is the best representation of the entire set of measurements. 

Learn more about determining the measures of central tendency.

Here are some examples of measures of central tendency:

Mean: The mean is simply the number around which the entire data is spread out. In this case, only a number – the mean – can be seen as the best representation of the whole data. 

Median: When you divide your set of data in two equal parts, you get one number at the medium which is called the median. Notice that in order to determine the median, the numbers of the set should be organized in an ascending or descending order. In case the number of terms of the set is odd, the median is the middle term; in case the number of terms of the set is even, the median will be equal to the average of the two middle terms. 

Check out these statistical questions examples.

Mode: Simply mode, the mode is the term that appears more time on the data set. 

#2: Measures Of Variability (Spread):

Measures-Of-Variability-(Spread)

The measures of variability assume that your data includes some variability. 

Here are some examples of measures of variability or spread: 

Standard Deviation: The standard deviation shows how the data is spread out from the mean So, in order to calculate the standard deviation, you needs to set the difference between each quantity and the mean. When you have the standard deviation is low, this means that the data points are closer to the mean of the data set. On the other hand, when you get a high standard deviation, the data points are spread out over more values and not concentrated around the mean only. 

Understanding what a statistical question is.

Mean Absolute Deviation Or Mean Deviation: This is the average of the absolute differences between each value and the average of all values of your data set. 

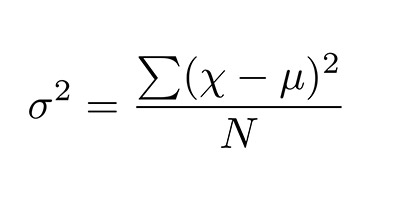
Variance: The variance is simply the square of the standard deviation. So, we can also say that the variance is the square of the average distance between each quantity and mean. 

variance-formula

Range: The range is the difference between the lowest and the highest value of your data set. 

Percentile: When you want to represent the position of the values that you ave on your data set, you can use the percentile. Notice that when you want to calculate the percentile, you need to have your data set in ascending order.