Category : Blog

Where To Get The Best Statistics Help Online

There’s no question that statistics can be a hard subject. The truth is that many students struggle with it. However, this is not only the case of students. Many times, researchers need to come up with different solutions to run their models to ensure that they get to valid conclusions and that they are able to build some reliable predictions about the future.

Discover everything you need to know about statistics.

statistics-help-online

As you already know, when you need to run statistical models, you need to rely on a sample of the population that you want to study. After all, relying on the overall population can be very costly not to mention time-consuming. Therefore, it is perfectly natural to use a sample of the population, as long as it is a representative sample, to run a model and answer the question that you want. 

Where To Get The Best Statistics Help Online

While there are many different statistics books and data analysis books that you may have the need to read, sometimes, you are simply looking for a straight answer. So, as you can imaginegetting statistics help online is the best option that you have. 

But how can you find the best resources about statistics online?

Simply put, when you are looking to get statistics help online, you need to know that you can get the information you need in 4 different ways.

#1: Statistics Courses:

Statistics-Courses

In case you are willing to spend some money, then you will be glad to know that there are some amazing statistics courses online that are pretty good. Depending o the area that you need information on, we are sure that you will be able to find the best course for you. Notice that while some of these courses are paid, you may also find others that are free.

#2: Statistics Websites:

Statistics-Websites

As you can imagine, there are tons of statistics websites where you can find vast information about statistics. Obviously, you should consider checking out StatCalculators.com where we only publish content regarding statistics. One of the best things about our website is that we are always adding new content. So, in case you have any questions, feel free to ask. We may simply answer you by email or, if it is a pertinent question, we may even write a complete post about it. 

From simple information to formulas and tests, you can find it all here.

#3: Calculators:

Calculators

When you are a statistics student or a researcher, you know that you need to perform a wide range of calculations. And while you may be using a software for some especially when you are dealing with a large data set, there are occasions when you need to make simpler calculations. And when you do, you can simply check our website where you will find all the formulas and calculators ready to help you out. 

As always, in case you miss a calculator, a formula, or even an explanation, just reach us out. 

#4: Statistics Books:

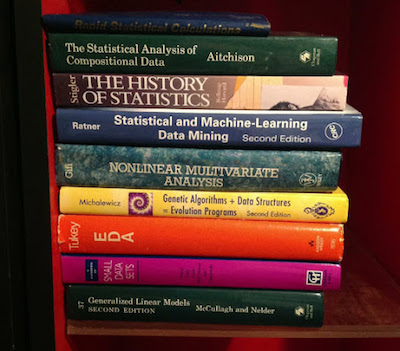
Statistics-Books

The truth is that when you are looking to learn a new subject, a book is always something to be considered. And this is no different in what concerns statistics. 

In case you don’t know, there is a wide range of statistics books for both novice, intermediate, and even advanced researchers. 


How To Use Descriptive Analysis In Research

Before we get into how to use descriptive analysis in research, we believe that it is important to define what descriptive analysis is in the first place. 

What Is Descriptive Analysis?

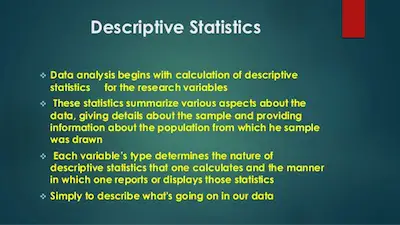
Simply put, descriptive analysis is one of the two main types of statistical analysis and it can be defined as the brief descriptive coefficients that summarize a specific data set which can be either a representation of the entire or a sample of a population. 

descriptive-analysis-in-research

Learn everything you need to know about statistics.

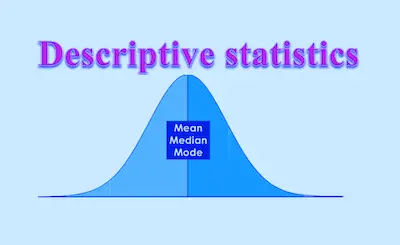
One of the things that you should keep in mind about descriptive analysis is that it can be broken down into measures of central tendency and measures of variability (spread). In case you don’t remember, the measures of central tendency include the mean, median, and mode, while the measures of variability include the standard deviation, variance, the minimum and maximum variables, and the kurtosis and skewness.

Understanding Descriptive Analysis

Understanding-Descriptive-Analysis

Overall, descriptive analysis helps describe and understand the features of a specific data set giving short summaries about the sample and measures of the data. 

As we already mentioned above, the most known or recognized types of descriptive statistics are measures of center: the mean, median, and mode, which are used at almost all levels of math and statistics. 

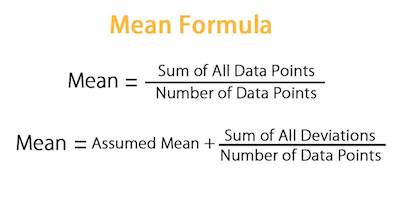
The mean which is the average is calculated by adding all the figures within the data set and then dividing by the number of figures within the set. 

Let’s say that you have the following data set: 2, 3, 4, 5, 6. 

So, the mean is 4 ((2 + 3 + 4 + 5 + 6)/5). 

The mode of the data set is the value that appears more often. And the median is the value that appears in the middle of the data set when the values are ordered from the smallest to the largest. 

Discover how you should use the student’s t test.

One of the most interesting facts about descriptive analysis is that it is mainly used to repurpose hard-to-understand quantitative insights across a large data set into bite-sized descriptions. 

Let’s take the GPA (grade point average) as an example. Simply put, this provides a good understanding of descriptive statistics. After all, the idea of a GPA is that it takes data points from a wide range of grades, classes, exams, and averages them together to provide a better understanding of a student’s overall academic capabilities. So, ultimately, a student’s personal GPA simply refers to the student’s mean academic performance. 

These are the degrees of freedom for t tests.

Measures Of Descriptive Analysis In Research

Measures-Of-Descriptive-Analysis-In-Research

As we already mentioned, descriptive statistics are either measures of central tendency or measures of variability which are also known as measures of dispersion. 

While the measures of central tendency focus on the average or middle values of data sets, the measures of variability focus on the dispersion of data. These two measures use graphs, tables, and general discussions to help people understand the meaning of the analyzed data.

Measures of central tendency describe the center position of a distribution for a data set. A person analyzes the frequency of each data point in the distribution and describes it using the mean, median, or mode, which measures the most common patterns of the analyzed data set.

Take a look at the advantages and disadvantages of measures of central tendency. 

In what concerns the measures of variability, they aid in analyzing how spread-out the distribution is for a set of data. For example, while the measures of central tendency may give a person the average of a data set, it does not describe how the data is distributed within the set. So, while the average of the data may be 65 out of 100, there can still be data points at both 1 and 100. Measures of variability help communicate this by describing the shape and spread of the data set. Range, quartiles, absolute deviation, and variance are all examples of measures of variability. 


What Is Stratified Sampling?

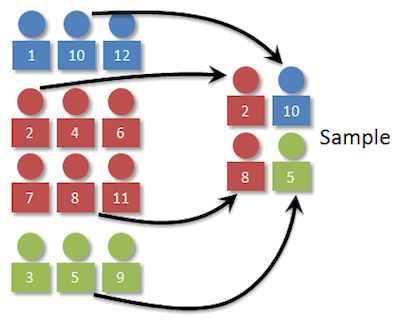
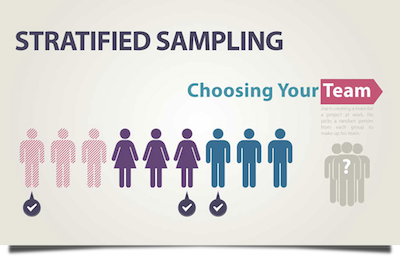
In case you have been learning statistics, then you probably already heard about stratified sampling. In case you don’t remember what stratified sampling is, you just need to know that it is a process that is used in market research that involves dividing the population of interest into smaller groups. These smaller groups are called strata. 

Discover the best statistics calculators.

stratified-sampling

Then, samples are pulled from the strata and the analysis is performed to make all the inferences about the greater population of interest. 

One of the most important concepts that you need to keep in mind when talking about stratified sampling is probability sampling. Simply put, it leverages random sampling techniques to create a sampling. 

While stratified sampling may be a new terminology for you, you may have already heard the term quota sampling or proportional sampling, which means exactly the same thing. 

Learn more about the degrees of freedom for t tests.

When To Use Stratified Sampling

Now that you already understand the concept of stratified sampling, it is time to understand when to actually use it. 

example-for-stratified-sampling

Strategy sampling is used when:

  • A researcher’s target population of interest is significantly heterogeneous;
  • A researcher wants to highlight specific subgroups within his or her population of interest;
  • A researcher wants to observe the relationship(s) between two or more subgroups; and,
  • A researcher’s goal is to create representative samples from even the smallest, most inaccessible subgroups of the population he or she is interested in.

When a researcher is using stratified sampling, he has a higher statistical precision compared to when he simply decides to use simple random sampling. And the reason is simple: the variability within the subgroups is lower compared to the variations when dealing with the entire population at large.

Thanks to the statistical precision that stratified sampling provides, a smaller sample size is required, which can ultimately save researchers time, money, and effort.

The Stratified Sampling Process

Stratified-sampling-process

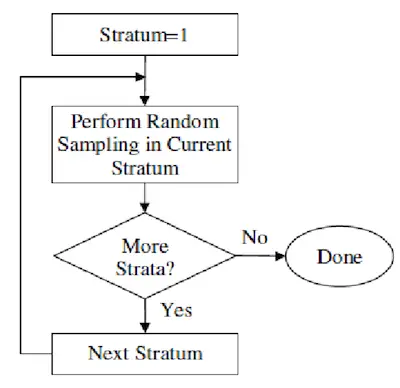
When you are trying to perform a stratified sampling, then you need to know that you need to follow a method. So, here are the steps that you need to follow:

Step #1: Divide the population into smaller subgroups, or strata, based on the members’ shared attributes and characteristics.

Find out everything you need to know about the z table.

Step 2: Take a random sample from each stratum in a number that is proportional to the size of the stratum.

Step 3: Pool the subsets of the strata together to form a random sample.

Step 4: Conduct your analysis.

Example For Stratified Sampling

Now that you already know what is and the process that you need to follow, there is nothing better than an example to understand this concept.

Let’s say that a group of researchers want to distribute a survey to 50 students that are either juniors or seniors in traditional American high school. 

Discover how to use the student’s t test. 

Here’s the gender breakdown:

YearBoysGirls
Junior12694
Senior7785
Total203179

One of the main difficulties of this study is that there is a lack of both time and money. Therefore, this survey can only be distributed to 50 students. So, to get more actionable and informative results, the sample needs to accurately represent the larger population of all students at the school. 

So, here’s the question: how many senior girls should be included in the 50 person sample?

The reality is that by looking at the above table, you can easily understand that the researchers were able to take the survey to 382 students, 85 of which were senior girls. But how does this translate to a sample of just 50 students?

In order to determine this, the researchers would simply take the fraction of 85/382 and multiply it by the sample size of 50. 

This yields a result of 11.2, which when rounded down, represents 11 senior girls that need to be surveyed in order to have a representative sample.


Understanding Inferential Statistics

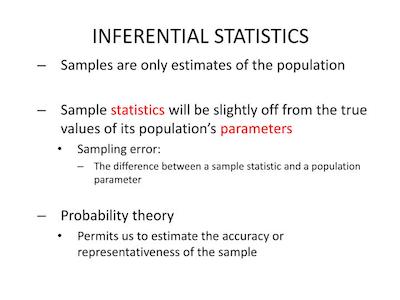
As you probably already know, inferential statistics is one of the two types of statistical analysis. Ultimately, it allows you to reach conclusions that go beyond the immediate data alone. To give you a simple example, inferential statistics allows you to infer from the sample data what the population may think. But this is not the only thing that it does.

Discover everything you need to know about statistics.

inferential-statistics

The reality is that inferential statistics also allows you to make judgments about the probability that an observed difference between groups is either dependable or one that may simply have happened by chance in this study. 

So, if you are trying to discover what is inferential statistics, then we can state that you use inferential statistics to make inferences from your data to more general conditions. 

Understanding Inferential Statistics

While there are many different inferential tests that you can perform, one of the simplest is when you want to compare the average performance of two groups on a single measure to see if there is a difference. For example, you may want to determine whether seventh-grade boys and girls differ in English test scores or whether a program group differs on the outcome measure from a control group. 

So, when you want to make this comparison or a similar comparison between two groups, you need to use the t-test for differences between groups. 

Understanding the difference between association and correlation.

what-is-inferential-statistics-1

Notice that most of the major inferential statistics come from a general family of statistical models that are often called as General Linear Model. So, besides the t test, it also includes Analysis of Variance (ANOVA), Analysis of Covariance (ANCOVA), regression analysis, and many of the multivariate methods like factor analysis, multidimensional scaling, cluster analysis, discriminant function analysis, among others. 

Since the General Linear Model is very important, when you are studying statistics it is ideal to become familiar with these concepts. Notice that while we have only mentioned a simple example of a t test that you should conduct to make the comparison above, the reality is that as you get familiar with the idea of the linear model, you will be prepared for more complex analysis. 

Using The Inferential Data Analysis

One of the main points that you should keep in mind when studying inferential analysis is to understand how groups are compared. And this is embodied in the notion of the “dummy” variable. 

Notice that by “dummy” variables we don’t mean that they aren’t smart or anything like this. The reality is that this is the name that we have to work with.

Simply put, a dummy variable is just a variable that uses discrete numbers, usually 0 and 1, to represent different groups in your study. So, you can easily understand that dummy variables are a simple idea that allows some complicated things to happen. 

For example, let’s say that you are running a model and that you want to include a simple dummy variable. When this happens, you can model two different lines – one for each treatment group – with a single equation. 

These are the major advantages and pitfalls of using the z score.

Factors That Influence Statistical Significance

inferential-data-analysis

When you run the different inferential tests, there are different factors that you need to take into account since they influence statistical significance. These include:

#1: The Sample Size:

The larger the sample, the less likely that an observed difference is due to sampling errors. So, you can then state that when you are dealing with a large sample, you are more likely to reject the null hypothesis than when the sample is small. However, it is also important to make it clear that you may have a sample that is so large that the statistics determine a significant difference which is so small they are meaningless. 

#2: The Size Of The Difference Between Means:

The larger the difference, the less likely that the difference is due to sampling errors. So, you can then conclude that when you have a large difference between the means, the more likely it will be to reject the null hypothesis. 

#3: The Amount Of Variation In The Population:

When a population varies a lot (is heterogeneous), there is more potential for sampling error. So, when you have only a slight variation, the more likely it will be to reject the null hypothesis. 

Error In Statistical Testing

Notice that in most cases, the level of significance or alpha is set at the 0.05 level. So, in this case, the null hypothesis is rejected if the p value (that you get from a table) that results from the calculations from the data is less than or equal to 0.05. So, this means that there are 5 chances in 100 (or 1 chance in 20) that the null hypothesis is correct, or to put it another way, there are 5 chances in 100 of being wrong by rejecting null hypotheses at this level. Investigators are never certain that the null hypothesis can be rejected, but they know that there is a 95% probability that they are correct in rejecting the null hypothesis. 

Discover the 5 different ways to detect multicollinearity.

Inferential Statistics Definition – The Limitations

inferential-statistics-definition

When you are using inferential statistics, you need to understand not only the advantages of using it but you should also know its limitations. 

So, overall speaking, there are mainly two disadvantages or limitations of using inferential statistics. 

The first limitation and one that is present on all inferential statistics, is the fact that you are providing data about a population that you have not fully measured. So, you will not ever be able to completely understand that the values or statistics that you calculate are correct. After all, inferential statistics are based on the concept of using the values measured in a sample to estimate or infer the values that would be measured in a population. Ultimately, there is always a degree of uncertainty in doing this. 

The second limitation of inferential statistics is related to the first one. However, it is important to point out that some inferential tests require you to make educated guesses to run the inferential tests. So, as you can easily understand, there is also a bit of uncertainty in this process. And this may lead to repercussions on the certainty of the results of some inferential statistics.


Types Of Statistical Analysis

One of the things that many people don’t know is that statistics is used in many different areas. Some of them may not even come to your mind when you think about it. Some examples include data analysis, financial analysis, business intelligence, market research, and many more. But why does this matter? Why is this important?

types-of-statistical-analysis

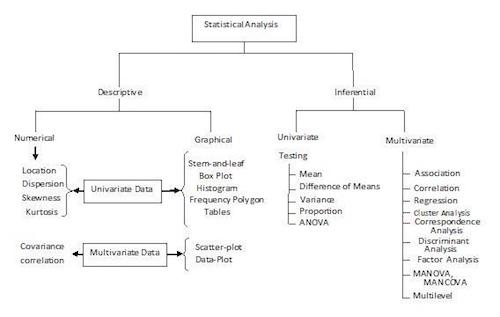
The truth is that statistics is the basis for many business decisions every single day. However, statistical analysis can be divided into two main types of statistical analysis – descriptive and inferential. 

Types Of Statistical Analysis

When you are analyzing information in the real world, you can use both descriptive as well as inferential statistics. The reality is that in many research done on groups of people like marketing research, for example, you can use both types of statistical analysis not only to analyze results but also to come up with conclusions. So, let’s check each type in more detail.

Check our our standard error calculator. 

#1: Descriptive Statistics:

Descriptive-Statistics

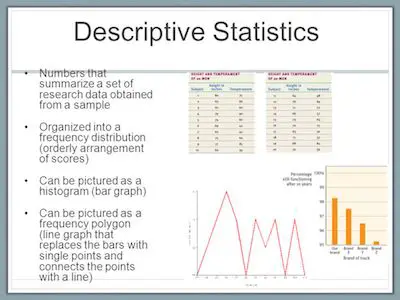
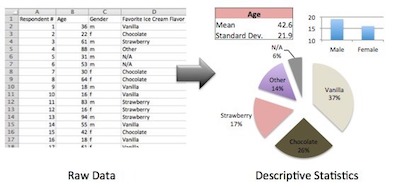
Simply put, descriptive statistics is mainly used to describe the basic features of information and then show or summarizes all the data in a rational way. So we can then state that descriptive statistics studies quantities. 

Notice that descriptive statistics uses the data from a specific population or a sample of it. As you already know, the population is a group. So, it can include numbers, tables, charts, graphs, and present raw data. 

One of the main aspects to keep in mind about descriptive statistics is that it doesn’t make any conclusions. The reality is that you’re not able to get conclusions as well as you won’t also be able to make generalizations beyond the data that you are considering. So, simply put, within the descriptive analysis, you can only describe what is and what the data shows. 

Looking to determine the standard error?

Here’s an example. Imagine a population of 30 workers in a business department. And at this point, you want to discover the average of that data set for 30 workers. However, you can’t discover what the eventual average is for all the workers in the whole company using just that data. Imagine, this company has 10 000 workers.

Despite that, this type of statistics is very important because it allows us to show data in a meaningful way. It also can give us the ability to make a simple interpretation of the data.

In addition, it helps us to simplify large amounts of data in a reasonable way.

Make sure to learn more about the standard error.

#2: Inferential Statistics:

Inferential-Statistics

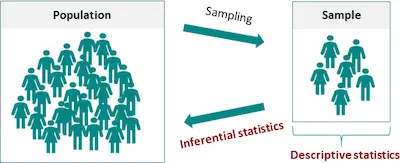
Inferential statistics is a bit more complicated than descriptive statistics. Simply put, inferential analysis allows you to infer trends about a larger population based on samples of subjects taken from it. 

So, as you can easily understand, this type of analysis allows you to study the relationships between variables within a sample, you can make conclusions, generalizations, and even predictions about a bigger population. 

One of the main advantages of using inferential analysis is the fact that it allows organizations and businesses to test a hypothesis and come up with conclusions about the data they have in hand. And this is quite helpful since in most cases, it is too expensive to study the entire population of people or objects. 


Statistics Basics – What You Need To Know

If you just decided to start studying statistics, then you need to know that there are some statistics basics that you need to be aware off. The truth is that these statistics basics that we are about to show you give you the basis of this new area and will be helpful as you’re now starting. 

Discover everything you need to know about statistics.

The reality is that statistics os a powerful tool when you are doing data analysis. After all, it allows you to get a lot of information and, sometimes, you are simply using simple charts and graphs. While a simple bar chart may deliver a high-level of information, the truth is that with statistics, you can get a more information-driven and target way. Ultimately, math helps you get to concrete answers and conclusions to the question that you are studying. 

Statistics-Basics

With statistics, you get a deeper insight into how your data is structured and then, based on that structure, how you can apply different techniques to get even more information. 

So, now that you already know that you need to learn some statistics basics, it is time to get started. 

Basics Of Statistics

One of the things that you need to understand about basics in statistics is that there are many different concepts and formulas that you need to always keep in mind. But don’t worry because we are going to take a look at each one of them. 

Statistics Basic Concepts

There’s no question that when you are looking at data that you collected and trying to get more information out of it, you will need to use some statistical features such as bias, variance, mean, median, percentiles, among others. 

basics-in-statistics

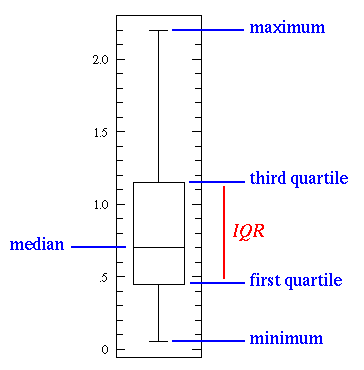
If you take a look at the above image, you will see different statistics basic concepts that are important when you are learning statistics. 

As you can see, the line in the middle is called the median value of the data. Ultimately, the median is used over the mean because it is more robust to outlier values. Then, you can see the quartiles. The first one is the 25th percentile which means that 25% of the points in the data fall below that value. On the opposite side, you have the third quartile which is the 75th percentile. This means that 75% of the points in the data fall below that value. Last but not least, you can also see the min and max values that represent the upper and lower ends of our data range. 

Check out our standard error calculator.

Besides, these simple basics in statistics, there is another one that is known as the three Ms: 

#1: Mean: 

basics-of-statistics

The mean is just the average result of an experiment, test, survey, or quiz. So, how can you calculate it?

Here’s an example. Let’s say that you discovered the heights of 5 different people: 5 feet 6 inches, 5 feet 7 inches, 5 feet 10 inches, 5 feet 8 inches, 5 feet 8 inches.

In order to determine the mean, you need to sum up all the heights and then divide the sum total by the number of heights that you discovered. So, in this case: 

Mean = (5 feet 6 inches + 5 feet 7 inches + 5 feet 10 inches + 5 feet 8 inches + 5 feet 8 inches) / 5

Mean = 339 inches / 5

Mean = 67.8 inches or 5 feet 7.8 inches

#2: Median:

statistics-basic-concepts

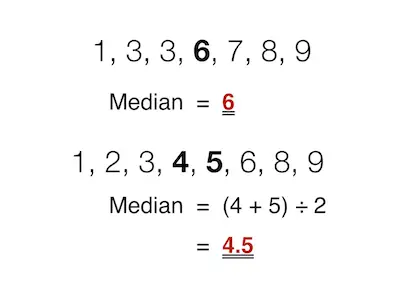
Median is the middle value of your data. So, as you can imagine, you need to calculate the median differently in case you have an odd amount of values or an even amount of values. Let’s take a look at each one of these cases:

  • Odd Number Of Values: 

Let’s take the previous example we used to calculate the mean above. In case you don’t remember, you had collected the heights of 5 people: 5 feet 6 inches, 5 feet 7 inches, 5 feet 10 inches, 5 feet 8 inches, 5 feet 8 inches.

To calculate the median, you need to order the numbers from the smallest to the largest first: 

5 feet 6 inches, 5 feet 7 inches, 5 feet 8 inches, 5 feet 8 inches, 5 feet 10 inches

As you can see, the value in the middle is 5 feet 8 inches which is also the median. 

Learn more about the standard deviation.

  • Even Number Of Values:

Let’s take another example of data. Imagine that you got the following values when you collected your data: 7, 2, 43, 16, 11, 5.

The first thing that you need to do to determine the median is to, again, line up the values in order from the smallest to the largest:

2, 5, 7, 11, 16, 43

And now you have 2 values in the middle – 7 and 11. To determine the median, you will need to calculate the mean between these two values: 

Median = (7 + 11) / 2 

Median = 9

#3: Mode: 

statistics-basics-formulas

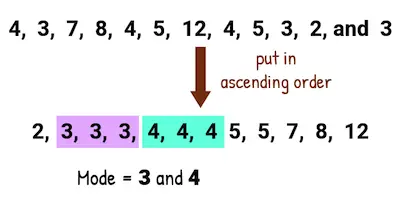
The mode is just the most common result that appears in your data set. Let’s use the same heights’ example once again: 5 feet 6 inches, 5 feet 7 inches, 5 feet 10 inches, 5 feet 8 inches, 5 feet 8 inches.

So, to determine the mode, you can put these values in order to make it easier to find the most common value in the data:

5 feet 6 inches, 5 feet 7 inches, 5 feet 8 inches, 5 feet 8 inches, 5 feet 10 inches

As you can see, the only value that repeats is 5 feet 8 inches – it occurs two times. 


Looking to calculate the standard error of the mean?

Variance

In statistics, another important concept that you need to understand is variance. Simply put, variance is just the spread of a data set. So, you can say that it is a measurement that is used to identify how far each number in the data set is from the mean. 

One of the things that you need to know about variance is that this is an important concept especially when you want to calculate probabilities of future events. The reality is that it is a great way to find all the possible values and likelihoods that a random variable can take within a specific range.

Some of the implications of the variance concept that you should keep in mind include:

  • The larger the variance, the more spread is in the data set. 
  • A large variance means that there are more values far from the mean and far from each other. 
  • A small variance means that the values in your data set are closer together in value.
  • When you have a variance that is equal to zero, this means that all of the values within your data set are identical. 
  • All variances that are not equal to zero are positive numbers. 

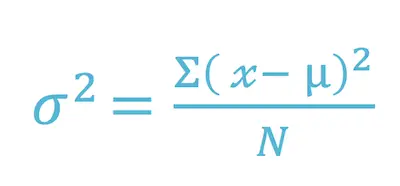
Now that you understand what variance is, you need to know how to calculate it. Simply put, the variance is the difference between each number in the data set and the mean, squaring the difference to make it a positive number, and then dividing it by the number of values on your data set. Here’s the formula:

variance-formula

Where:

X = individual data value

u = the mean of the values

N = total number of data values in your data set.

One of the things that is worth noting is that when you are calculating a sample variance to estimate a population variance, the denominator of the variance equation becomes N – 1. This removes bias from the estimation, as it prohibits the researcher from underestimating the population variance.

One of the main advantages of variance is the fact that it treats all deviations from the mean of the data set in a similar way, no matter the direction. The main disadvantage of using the variance is the fact that it gives added weight to values that are far from the mean (outliers). And when you square these numbers, you may get skewed interpretations of the data set as a whole. 


Use our standard error calculator to confirm your results.

Covariance

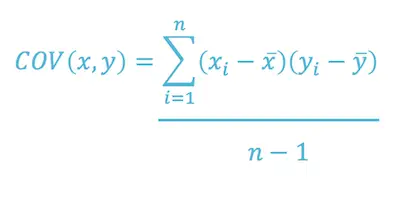
Among the statistics basics formulas, there is another one that is especially important – covariance. But before we get to the formula, you need to understand what covariance is. 

Simply put, covariance shows you how two variables are related to one another. So, more technically, covariance refers to the measure of how two random variables in a data set will change together. 

  • When you have a positive covariance, this means that the two variables are positively related which is the same as saying that they move in the same direction. 
  • When you have a negative covariance, this means that the two variables are inversely related which is the same as saying that they move in opposite directions. 

Here’s the covariance formula:

covariance-formula

Where:

X = represents the independent variable

Y = represents the dependent variable

N = represents the number of data points in the sample

X-Bar = represents the mean of the X

Y-Bar = represents the mean of the dependent variable Y

Bottom Line

As you can see, these basic statistical terms are very simple to understand and you shouldn’t have any difficulties in putting them into practice. However, these basic concepts and formulas are extremely important since they are the basis of statistics. 


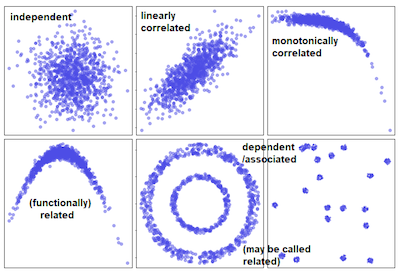
The Difference Between Association and Correlation

One of the questions many statistics students have is to know the difference between association and correlation. The truth is that many believe that association and correlation are the same thing or mean the same thing. However, and even though this may sound a silly question, the truth is that both concepts can make arise the similarity or difference between the two concepts. 

association and correlation

Understanding statistics in 2020.

The reality is that this confusion can be understood because in regular English, correlated and associated at both related to the same thing. On the other hand, in technical terms, correlation is the strength of association as measured by a correlation coefficient. In what concerns to

association, this is not a technical term at all. It simply means the presence of a relationship: certain values of one variable tend to co-occur with certain values of the other variable.

Looking for a standard error calculator?

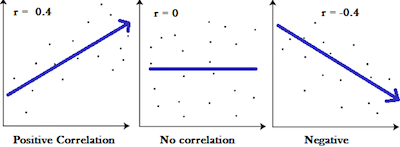
One of the things that you need to keep in mind is that correlation coefficients vary between -1 and 1. When they are equal to -1, this means that there is a perfect negative relationship: high values of one variable are associated with low values of the other. Likewise, a correlation of +1 describes a perfect positive relationship: high values of one variable are associated with high values of the other. When the correlation coefficients are equal to zero, this means that there is no relationship. The same is saying that high values of one variable co-occur as often with high and low values of the other.  There is no independent and no dependent variable in a correlation. It’s a bivariate descriptive statistic.

correlation

The most common correlation coefficient is the Pearson correlation coefficient. Often denoted by r, it measures the strength of a linear relationship in a sample on a standardized scale from -1 to 1.

It is so common that it is often used synonymously with correlation.

Check out our standard error online calculator.

Notice that Pearson’s coefficient assumes that both variables are normally distributed. This requires they be truly continuous and unbounded.

But when you’re interested in relationships of non-normally distributed variables, you should use other correlation coefficients that don’t require the normality of the variables. Some include the Spearman rank correlation, point-biserial correlation, rank-biserial correlation, tetrachoric, and polychoric correlation.

Notice that there are still other measures of association that don’t have those exact same properties. They tend to be often used where one or both of the variables is either ordinal or nominal. These tend to include measures such as phi, gamma, Kendall’s tau-b, Stuart’s tau-c, Somer’s D, and Cramer’s V, among others.

Here’s how to calculate standard error online.

Bottom Line

different types of correlation

The most important thing that you need to keep in mind is that there is a difference between association and correlation. Besides, you also need to be aware that there are many different measures of association. However, only some of these are correlations. 

Notice that while we are clearly establishing a difference between association and correlation, there isn’t really a consensus between researchers and analysts in this matter. So, you should always clearly explain what you mean with both association and correlation to avoid any misinterpretations.


Count Variables Vs Continuous Variables: Understanding The Differences

When you are looking at data statistics, there are many relevant concepts. And the reality is that one of the most important things that you need to realize is that the analysis needs to be appropriate for the scale of measurement of the variable. Notice that the focus of these decisions about scale needs to focus on levels of measurement that can be nominal, ordinal, ration, and interval.  

One of the things that you should keep in mind about these levels of measurement is the fact that they tell you about the amount of information in the variable itself. However, there are other ways to establish the difference between scales. 

count variables vs continuous variables

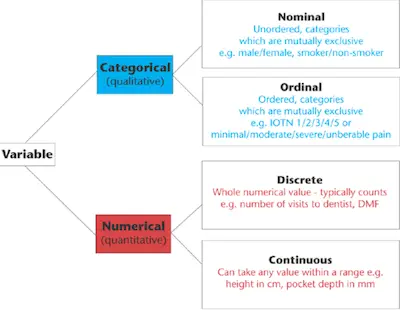
If you take a closer look at ratio-level variables, for example, you can find two different types: discrete and continuous. While discrete variables only take integers, continuous variables take on any value on a number line. In case you are wondering why this matters in statistics, the reality is that you measure the probabilities in a different way depending on if they are discrete or continuous distributions. 

The probability of each value of a discrete random variable is described through a probability distribution. At its simplest, this is a list of all the values in the set and the probability of each value occurring.

Discover how to calculate t value.

continuous vs discrete

However, you need to know that the probabilities of many discrete random variables follow patterns that can be described with a mathematical function. This function is called a probability mass function.

As you can imagine, there are numerous discrete probability distributions including Bernoulli, binomial, hypergeometric, discrete uniform, and Poisson. There are explicit criteria that determine which probability distribution is appropriate for a specific discrete random variable.

Count data are a good example. A count variable is discrete because it consists of non-negative integers. Even so, there is not one specific probability distribution that fits all count data sets.

Looking for a t value calculator online?

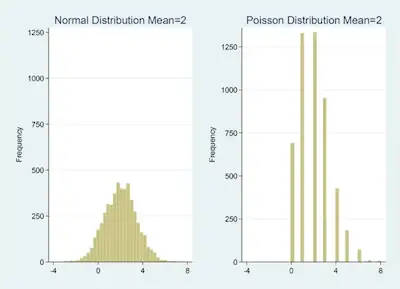
Normal - Poisson Distribution

The Poisson distribution often fits count data. It fits well when the mean of the variable is equal to its variance. So how do you determine that?

All you need to do is to run a summary of your variable in your statistical software package and then compare the mean to the variance. If the standard deviation is listed instead of the variance, just square the standard deviation. If they are almost equal, then that’s a good sign.

But many count variables fail these tests.

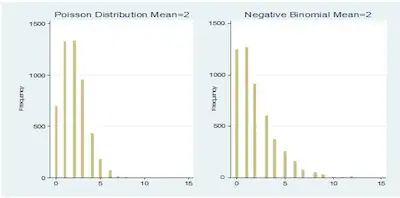
Below are two graphs generated with Poisson and negative binomial probability distribution functions. Each has 5,000 observations. The mean of the Poisson data is 2, the variance is 1.99, and the range is from 0 to 8. The mean of the negative binomial data is 2, the variance is 4.16, and the range is from 0 to 15.

The negative binomial distribution contains an extra parameter that allows the variance to be greater than the mean. If you tried to fit a data set with that mean and variance to a Poisson distribution, it would be considered overdispersed — not a good fit.

Check out our quick t student calculator.

Poisson Negative Binomial

The Normal Distribution

If the mean of a Poisson or negative binomial variable is high enough, it will be symmetric and bell-shaped. It will look like a normal distribution, except for one key distinction – normal variables are truly continuous, not discrete. This means that they can take on any possible value.

As a result, there are an infinite number of values (2.30546 is a different value than 2.30547). So, it makes no sense to calculate the probability that X is any exact value in a continuous variable. That probability is infinitesimal, a value approaching zero.

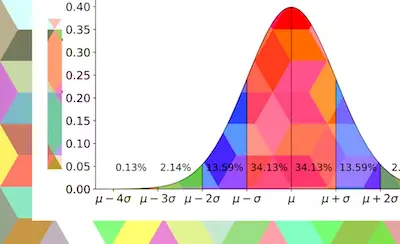
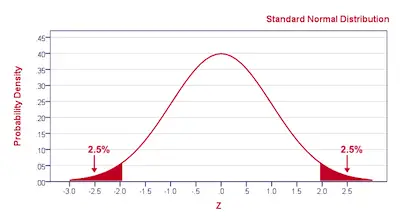
With continuous variables, the probability of a value falling within a range is calculated instead. For example, there is a 95% probability that a value from a normal distribution will fall within 1.96 standard deviations of the mean of that distribution.

To show you the difference, I created a set of 5,000 random values from a normal distribution with a mean and variance of 2. The range of the data is -2.512433 to 7.461702. Included next to its graph is the graph of the Poisson variable with a mean and variance of 2.


How to Reduce the Number of Variables to Analyze

When you are looking at data sets, it is normal that you find some that have more than a thousand variables. So, while you may be compelled to continue with this complexity taking advantage of the speed of computers, you should stop right there. The reality is that, sometimes, when this occurs and you maintain all the dataset as it is, you end up with a vast array of poor results. So, how can you reduce the number of variables to analyze? 

variables

Discover everything you need to know about statistics.
Why You Should Select Variables Before Analyzing The Data

One of the things that many students don’t realize is that working with a lot of data is a problem. After all, everything they can think of is on how to plunge into a data analysis and don’t even think about the step they are taking. However, this is something that should always be avoided. 

Whenever you have a new dataset, the first thing you need to do is to think about what you want to get from it. When you don’t take this step, you will probably end up with biased results. 

Looking for an online z calculator?

Select Variables Before Analyzing The Data

It is important that you are aware that there are many different and powerful techniques that you can use when dealing with many variables. One example is the multiple regression that allows you to include a very large number of predictor variables with the goal of maximizing the explanatory power of the model. But this isn’t the only one. You also have factor analysis, for example. However, and while it may nearly always produce a solution, it may well be a nonsense solution.

Ultimately, factor analysis is designed to identify sets of variables that are tapping the same underlying phenomenon. And it does this by examining the patterns of correlations among a set of variables.

Factor analysis is based on the assumption that the variables that are identified as belonging to a factor are really measuring the same thing. So, the factor itself is driving the responses on the individual variables. Therefore, they should not be causally related to each other.

Unfortunately, factor analysis cannot distinguish between variables that are causally related and those that are non-causally related. This can result in variables being grouped together when they should not be. 

Make sure to use our simple a value calculator.

How to Reduce the Number of Variables to Analyze

How to Reduce the Number of Variables to Analyze

When you want to reduce the number of variables to analyze, you just need to think about the research question that you are trying to answer and to determine which data is directed. 

One of the ways that you have to do this is to simply draw diagrams of the model that you want to evaluate before you start analyzing the data. This way, you will need to first determine the dependent variable and only then the independent variable. In addition, you should also determine the likely mechanisms by which the independent and dependent variables might be related.

Check out our easy z stat calculator.

Notice that you should make some attempt to include variables that make sense together. In addition, you should avoid including variables where any correlation is more likely due to causal relationships than to the variables having something in common at the conceptual level.


Differences Between Explanatory Models And Predictive Models

As a statistics student or as a researcher, you know that sometimes you are asked to create a specific model. Let’s say that you are asked to create a specific model that predicts who will drop out of college in a specific year. So, you decide to use a binary logistic regression. After all, you know that your outcome will only carry two values: 0 for not dropping and 1 for dropping out. 

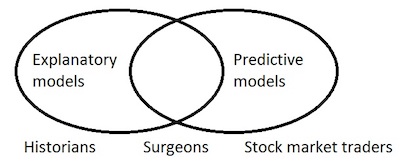
explanatory models and predictive models

Learn everything you need to know about statistics.
The truth is that no matter if you are a student or already a researcher, you were trained to build models with the purpose of discovering and understanding the relationships that may exist between an outcome and a set of predictors. However, what you may not know is that model building only works for predictive models. So, how can you solve this situation? 

This is what we are about to discover today by looking into explanatory models and predictive models and stating their differences. 

Explanatory Models

Explanatory Models

When you are using explanatory models, then you understand that you are looking to identify variables that have a scientifically meaningful and statistically significant relationship with an outcome. 

So, your main goal is to test the theoretical hypothesis to ensure that there is an emphasis on both theoretically meaningful relationships and determining whether each relationship is statistically significant.

Some of the steps in explanatory models include fitting potentially theoretically important predictors, checking for statistical significance, evaluating effect sizes, and running diagnostics.

Looking for a quick t student calculator?

Predictive Models

Predictive Models

When you pick a predictive model, your main goal is different. In this case, your goal is to use the relationships between predictors and the outcome variable to generate good predictions for future outcomes. With this in mind, you can easily understand that predictive models are created in a very different way than explanatory models. After all, in this case, you are looking for predictive accuracy. 
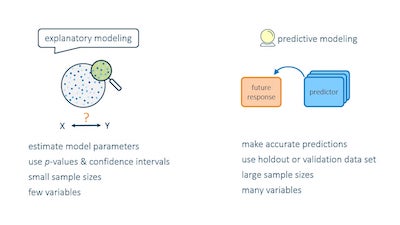
Variables that are used in a predictive model are based on association, and not on statistical significance or scientific meaning.

There are times when statistically significant variables will not be included in a predictive model. A significant predictor that adds no predictive benefit is excluded.

Learn how to calculate t value.

If the predictor is significant but only observable immediately before or at the time of the observed outcome, it cannot be used for predictions.

For example, theoretical models have shown that water temperatures are a highly significant factor in determining whether a tropical storm turns into a hurricane. That variable is not useful in a prediction model of the expected number of hurricanes during the upcoming season because it can only be measured immediately before an impending hurricane.

Explanatory Models And Predictive Models - the differences

That’s too late.

One of the things to keep in mind when you are using predictive models is that you should always explore. Changing the effect of a continuous predictor by squaring or taking the square root of its value is one approach. The primary limitation for including a predictor in the model is its availability for future model running.

Make sure to use our free student t value calculator.

The primary risk when creating a predictive model is to avoid overfitting which is the result of creating a model that fits the current sample so perfectly that it may not be a good representation of the population. So, how can you decrease this risk?

The best thing to do in this case is to only use half of your data to create your model. Then test your model on the other half.