Category : Blog

Rules For Rounding Numbers In Statistics

In statistics, you probably never even thought that there are some rules that you need to follow in what concerns rounding numbers. 

The reality is that you need o deal with very large decimals and you may need to round them. So, what are the rules for rounding numbers in statistics? Should you simply follow the regular methods you learned in math classes?

Before we get into details, it’s important that you are well aware of concepts such as digit, an even number, an odd number, decimal format versus decimal place, and particularly, and what is a significant digit. It is especially important to keep in mind that there is a very big difference between the decimal place and a significant digit.

For example, the numbers 0.00036, 36, and 36,000,000 all have 2 significant digits – 3 and 6 – but different decimal places. 

Lear more about rounding numbers.

Rules For Rounding In Statistics

Step #1: Determine the Number of Significant Digits to Save

The number of significant digits to save is suggested by the precision of the measuring instrument for individual numbers and variability observed in a series of numbers. 

The precision of a measurement refers to its repeatability, whereas accuracy relates to how close the measurement is to the truth. Standard deviation is an expression of the inherent variation of the numbers. In contrast, numbers such as regression coefficients are generally accompanied by their standard error, as the expression of the precision of those derived estimates. These measures of precision are the key to determining the number of significant digits to save. 

For convenience, we will describe significant digits in terms of the mean and standard deviation. For cases in which the standard error is used, just translate ‘‘standard deviation’’ into ‘‘standard error.’’ 

Make sure to check out this rounding calculator.
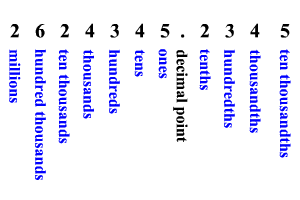
The place of the first significant digit of the standard deviation is found, and the mean or proportion is rounded to that place. The same place is saved in confidence limits. The standard deviation generally will be expressed to 1 additional place. Here are some examples: 

#1: The mean age is 72.17986 and the standard deviation is 9.364132:

Nine is the first significant figure of the standard deviation and is in the ones place. Thus, we will keep 2 significant digits in the mean and 2 in the standard deviation: 72 and 9.4. 

#2: The mean cost is $72,347.23 and the standard deviation is $23,994.06: 

The 2 in the 10-thousands place is the first significant digit in the standard deviation. Thus, the mean cost would be expressed to 1 significant digit, and the standard deviation to 2 significant digits: $70,000 and $24,000. 

Looking for a good rounding calculator to help you out?

Step #2: Look for Exceptions:
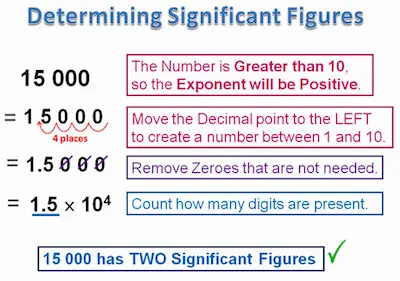
Number of Significant Digits

There are some exceptions that need to be considered. These include:

  • If the first significant digit of the standard deviation is 1, then 1 additional significant digit in the mean or proportion and standard deviation may be saved.
  • For percentages between 0% and 10% or between 90% and 100%, keep at least 2 significant digits.
  • Within a single table, consistency in saving digits may be desirable, so all numbers may be rounded to the place indicated by the majority of the numbers. 

Step #3: Round the Numbers:

 Round the number by removing digits from its right side that falsely suggest a high degree of precision. This is how it’s done:  

  • If the digit in the first place beyond (to the right of) the significant digit to be rounded is > 5, add 1 to the right-most digit to be retained and drop all other digits to its right. This is called rounding up. Thus, 2.77 to 2 significant figures would be rounded to 2.8. Similarly, 1479.336 to 2 significant figures would be rounded to 1500 and 0.000649376 would be rounded to 0.00065.  
  • If the digit in the first place beyond the significant digit to be rounded is<5, simply drop it and all other digits to its right. This is called rounding down. Thus, 3.44 to 2 significant figures would be rounded to 3.4. Similarly, 98,432.19 would be rounded to 98,000 and 0.00013175 would be rounded to 0.00013.  
  • If the digit in the first place beyond the digit to be rounded is exactly 5, add 1 to the rightmost digit to be retained if the last significant digit is odd (ie, 1, 3, 5, 7, or 9), and leave the digit to be rounded as is if it is even (ie, 0, 2, 4, 6, or 8). This rule results in the rightmost significant digit always being an even number.5 Thus, 9.450000 to 2 significant figures would be rounded to 9.4, but 9.750000 would be rounded to 9.8.
Benefits Of Using A Standard Error Calculator

When you are learning and studying statistics, you will soon realize that you need to use calculators to determine a wide variety of variables. The truth is that while you can do some of these calculations by hand (especially when you are dealing with small samples of population), it is easy to make mistakes. So, you want to ensure that you always have a good standard error calculator in hand. 

standard error calculator

Discover the best online statistics calculators.

Before we show you the benefits of using a standard error calculator, we believe that it is important that you first understand what the standard error is first. 

What Is The Standard Error?

What Is The Standard Error?

Simply put, the standard error os a statistic is just the approximate standard deviation of a statistical sample population. So, if you want to take a more practical definition, you can also say that the standard error calculator is a statistical concept or term that determines the accuracy with which a sample distribution represents a population by using standard deviation. 

Looking for a good standard error calculator?

When we are talking about statistics, it is important to always keep in mind that a sample mean deviates from the real mean of the population. And this deviation is known as the standard error of the mean. 

Understanding The Standard Error

Understanding The Standard Error

When you listen to or read the term standard error, you need to know that it refers to the standard deviation of the different sample statistics like the median or mean. For example, when you see the term standard error of the mean, then you know that it refers to the standard deviation of the distribution of sample means that were taken from a population. 

Start using our standard error calculator today. 

Notice that the smaller the standard error that you get, the more representative the sample will be of the entire population. 

The truth is that there is a very deep connection between the standard error and the standard deviation. After all, for any given sample size, the standard error is always equal to the standard deviation divided by the square root of the sample size. Besides, you should also know that the standard error is also inversely proportional to the sample size. This means that the larger the sample size, the smaller the standard error. And this occurs because the statistic will always tend to approach the real or actual value. 

It’s important to understand that the standard error is considered a part of the descriptive statistics. After all, as you can easily understand, it represents the standard deviation of the mean within a dataset. Therefore, this serves as a measure of the variation of random variables, providing a measurement for the spread. So, the smaller this spread, the more accurate the dataset. 

Discover the simplest online calculator to determine the standard error.

Benefits Of Using A Standard Error Calculator

Benefits Of Using A Standard Error Calculator

The truth is that there are many benefits of using a standard error calculator. These include:

  • Knowing how much data is clustered around the mean value
  • Getting a more accurate idea of how the data is distributed
  • Not being affected by extreme values
  • No mistakes: with a standard error calculator, you won’t make so many mistakes when you need to calculate the different variables and statistics. 

Standard Error Of Mean Vs Standard Deviation

When you are learning statistics, two of the first concepts that you will need to understand are the standard error of mean and the standard deviation. However, many students tend to confuse both. So, to prevent this from happening to you, we decided to tell you a bit more about each one of these concepts as well as show you the differences between them. 

Discover the best statistic calculators online.

Standard Error Of Mean Vs Standard Deviation

standard error of mean

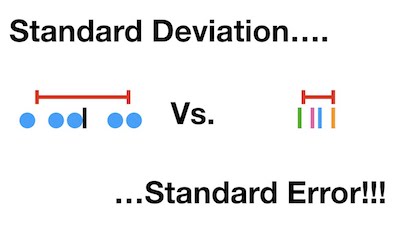
Simply put, the standard deviation measures the amount of dispersion or variability for a specific set of data from the mean. On the other hand, the standard error of mean measures how far the sample mean of the data is likely to be from the true population mean. 

One of the things that you should keep in mind is that the standard error of mean is always smaller than the standard deviation. 

Check out our standard error calculator.

When They Are Both Used

Notice that in some instances, researchers can use both the standard error of mean and the standard deviation. This occurs, for example, in some clinical experimental studies. 

In these particular cases, both the standard error of mean and the standard deviation are used to display the characteristics of the sample data as well as they both serve to explain the statistical analysis results. 

Standard Error Of Mean Vs Standard Deviation

Discover how to easily determine the standard error with our calculator. 

A very important aspect to consider is that there are many researchers who tend to use both concepts as if they were the same. This is especially the case os studies related to medical literature. So, it is very important that these researchers keep in mind that the standard error of mean and the standard deviation are two different concepts. As we already explained above, the standard deviation is the dispersion of the data in a normal distribution. This simply means that this measure indicates how accurately the mean actually represents the sample data. On the other hand, the standard error of mean includes statistical inference that is based on the sampling distribution. 

Calculating Standard Error Of Mean

calculating standard error of the mean​

As you can see, when you need to calculate the standard error of mean, you need to take the standard deviation and divide it by the square root of the sample size. 

If you take a closer look at the standard deviation formula, then it is easy to understand that you need to follow some steps:

#1: Take the square of the difference between each data point and the sample mean, finding the sum of those values.

#2: Now, divide that sum by the sample size minus one, which is the variance.

#3: Finally, take the square root of the variance to get the SD.

Confirm your results with our simple standard error calculator.

Bottom Line

Simply put, the standard error of mean is just an estimate of how far the sample mean is likely to be from the population mean, whereas the standard deviation of the sample is the degree to which individuals within the sample differ from the sample mean. 

So, if the population standard deviation is finite, the standard error of the mean of the sample will tend to zero with increasing sample size, because the estimate of the population mean will improve, while the standard deviation of the sample will tend to approximate the population standard deviation as the sample size increases.


The Distribution of Independent Variables in Regression Models

When you are using regression models, it is normal that you use some distribution assumptions. However, there is one that can’t have any assumptions – the one that refers to independent variables. But why?

The reality is that if you think about it, this makes perfect sense. The reality is that regression models are directional. So, this means that in a correlation, there is no evident direction since Y and X are interchangeable. So, even if you switch the variables, you would end up with the same correlation coefficient. 

regression models

Use the best statistics calculators.

Nevertheless, it is important to keep in mind that regression is a model about the outcome variable. So, what predicts its value and how well does it predict it? And how much of its variance can be explained by its predictors? If you notice, we are posing questions that are all about the outcome. 

One of the things that you should keep in mind about regression models is the fact that the outcome variable is considered a random variable. So, as you can easily understand, this means that while you can explain or even predict some of its variation you can’t really explain all of it. After all, it is subject to some sort of randomness that affects its value in any particular situation. 

In what concerns predictor variables, this isn’t true. After all, when we are talking about predictor variables, we are talking about variables that assume to have no random process. So, there are absolutely no assumptions about the distribution of predictor variables. Besides, they don’t have to be normally distributed, continuous, or even symmetric. But you still need to be able to interpret their coefficients. 

Discover how to calculate the p-value for a student t-test.

Analyzing The Distribution of Independent Variables in Regression Models

Distribution of Independent Variables

#1: You need to have a one-unit difference in X. In case X is numeric and continuous, then a one-unit difference in X makes perfect sense. On the other hand, if X is numeric but discrete, then a a one-unit difference still makes sense.

If X is nominal categorical, a one-unit difference doesn’t make much sense on its own. A simple example of this variable is Gender. In case you code the two categories of Gender to be one unit apart from each other, as is done in dummy coding, or one unit apart from the grand mean, as is done in effect coding, you can force the coefficient to make sense.

But what if X is ordinal–ordered categories? There is no clever coding scheme that can preserve the order, but not treat all the one-unit differences as equivalent. So while there are no assumptions that X are not ordinal, there is no way to interpret coefficients in a meaningful way. So you are left with two options–lose the order and treat it as nominal or assume that the one-unit differences are equivalent and treat it as numeric.

statistical models

Discover how to calculate the t-statistic and degrees of freedom.

#2: While the structure of Y is different for different types of regression models, as long as you take that structure into account, the interpretation of coefficients is the same. This means that although you need to have to take the structure of Y into account, a dummy variable or a quadratic term works the same way in any regression model.

#3: The unit in which X is measured matters. This might be useful to conduct a linear transformation on X to change its scaling. 

Learn how to calculate the two-tailed area under the standard normal distribution.

#4: The other terms in the model matter. Some coefficients are interpretable only when the model contains other terms. For example, interpretations aren’t interpretable without the terms that make them up (lower-order terms). And including an interaction changes the meaning of those lower-order terms from main effects to marginal effects.


Steps to Take When Your Regression Results Look Wrong

When you are doing statistical analysis, sometimes you stop wondering if your results can actually be correct. The truth is that while you took all the necessary steps and you are interpreting them, it seems that they just don’t make sense. No matter if you are thinking about the results using logic or theories, they just look wrong. 

regression results

Discover all the stats calculators you need.

The truth is that the first feeling you tend to experience on these occasions is panic. However, there’s no need to feeling this way. In fact, while there are many possible causes of incorrect results, there are some steps that you can take that will help you discover what you did wrong and how you can correct it. 

Steps to Take When Your Regression Results Look Wrong

#1: Errors In Data Coding And Entry:

One of the most common errors that you may commit when you are doing regressions is regarded with data coding and entry. 

The truth is that you may forget to reverse code the negatively-worded items on a scale, for example. And while they may not be that important, you will see them when you place them in the wrong place if you look at bivariate graphs.

Check out our Z-score calculator.

#2: Misinterpretations:

Misinterpretations

One of the things that tend to happen frequently is that sometimes, your results aren’t wrong. You’re interpreting or reading them the wrong way. 

Notice that while some misinterpretations come from software defaults, others come from the way the statistics are calculated. And on this kind of error, regression coefficients may be a bit tricky. After all, they change meaning depending on other terms in the model. 

For example, with an interaction term in a regression model, coefficients of the component terms are not main effects, as they are without the interaction. So including an interaction can easily reverse or otherwise drastically change what looks like the same coefficient.

Looking for a binomial probability calculator?

#3: Misspecifying The Model:

Misspecifying The Model

Another common factor that may lead to regression results looking wrong is that you may not be using the best model for the data you have. So, in this case, your results may look wrong because they’re not accurate. Maybe you need to use a different type of model for your design and variables or there might be some effects that you didn’t include such as important control variables, non-linear effects, or interactions. 

#4: Bigger Data Issues:

Bigger Data Issues

You already know that when you are doing statistical analysis you need to use high-quality data. However, you may have an issue with missing data and when you are using a software in multivariate analyses, this may lead to getting a lot of data getting dropped even if the percentage of missing data is small on any one variable. 

Check out our student t-value calculator.

Steps to Take When Your Regression Results Look Wrong

So, how can you know what problem you are having? 

The truth is that you just need to follow some steps in order to discover what you should do:

#1:  Run univariate and bivariate descriptive statistics and graphs. 

#2: Read output and syntax carefully. 

#3: Check model assumptions and diagnose data issues like multicollinearity and missing data. Most model misspecifications will appear in model diagnostics.

Finally, consider the possibility that the unexpected result is correct. If you’ve gone through all the diagnoses thoroughly and you can be confident there aren’t any errors, accept the unexpected results. They’re often more interesting.


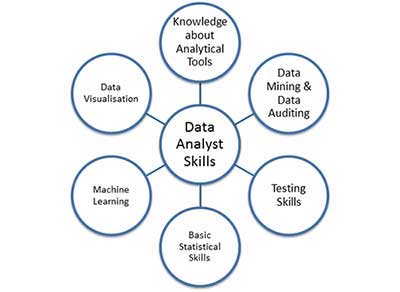
6 Data Analysis Skills Every Analyst Needs

While you may think that by only knowing statistics better you have all that it takes to do data analysis, this isn’t quite true. The reality is that you should keep in mind that statistical knowledge is only a part of the equation. The second part os developing data analysis skills. 

Lara everything you ned to know about stats.

data analysis skills

One of the things that you should keep in mind about data analysis skills us that they apply to all analyses no matter the software or statistical method you are using. 

In order to start developing these data analysis skills, you need to have some statistical knowledge. However, as you learn these skills, you’ll notice how statistics make more sense. 

6 Data Analysis Skills Every Analyst Needs

#1: Planning The Data Analysis:

When you have a data analysis project, you want to ensure that you have a plan. The truth is that it will allow you to think ahead on critical decisions that may take you a lot of time if you have to redo them again. 

Check out our covariance calculator.

#2: Managing The Data Analysis Project:

Managing The Data Analysis Project

When you are working on a data analysis project, no matter if you are doing it alone or with others, you need to manage it. This includes keeping track of the times, dedicating enough time to each step, and even find the resources that you need. 

#3: Cleaning, Coding, Formatting, And Structuring Data:

When you are working on a data analysis project, you always want to ensure that your data is cleaned before you even start. But your work doesn’t stop there. After all, you will need to code and format the variables and then structure them according to your plan. 

Notice that this is probably the step that takes longer. 

Looking for a correlation coefficient calculator?

#4: Running Analysis In An Efficient Order: 

Running Analysis In An Efficient Order

One of the things that is important to keep in mind is that there is a specific order that you need to obey when you are running the steps of your analysis. Besides, you will need to make decisions at every step. When you don’t do this, your analysis will not only be slower but frustrating as well. Besides, you’re likely to make mistakes. 

#5: Checking Assumptions And Dealing With Violations:

Unlike what you may have heard, all statistical test and model has its own assumptions. The truth is that there is a lot of skill in reading uncertain situations and drawing conclusions. 

Check out our standard error calculator.

#6: Recognizing And Dealing With Data Issues:

Recognizing And Dealing With Data Issues

One of the things that you probably already know is that real data is messy data. This means that real data has issues that make the analysis hard. From small sample sizes to outliers, and even truncated distributions can happen in all types of data sets. So, you need to ensure that you recognize when a data issue is happening as well as you need to determine if it will cause problems or what you need to do about it. 


Should Confidence Intervals or Tests of Significance be Used?

When you are learning statistics, it is normal that you learn about confidence intervals. But what are confidence intervals?

What Are Confidence Intervals?

confidence intervals

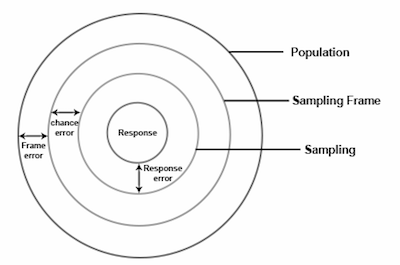
When you use a sample of the population, you are subject to sampling error. After all, as you can easily understand, sample statistics can’t match exactly the population parameters that they estimate. 

Discover the best statistics calculators online. 

Therefore, you need to think that you may have a sampling error. 

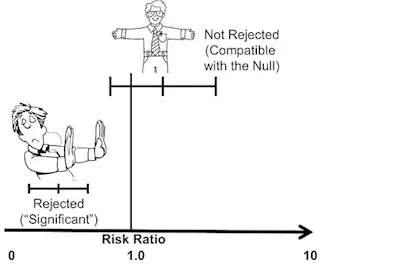
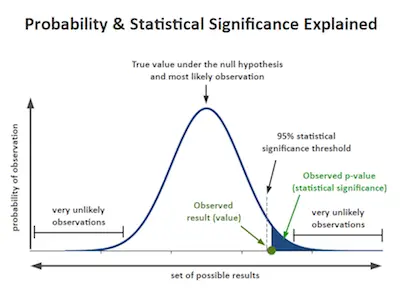
One of the things that you can do to deal with sampling error is to simply ignore results if you believe there is a chance that they could be due to sampling error. In case you don’t know, this is the approach that you should use when you are working with significance tests. As a rule of thumb, sample effects are treated as being zero when you have more than 5% or 1% chance they were produced by sampling error. 

Check out our confidence interval calculator for the population mean.

sampling error

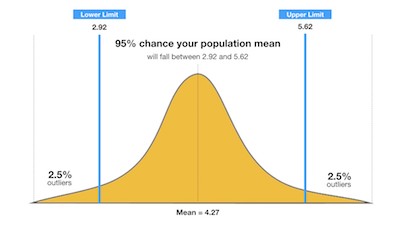
However, instead of using significance tests, you may prefer using confidence intervals. In this case, instead of deciding whether a sample data support that the null hypothesis is true, you can, instead, take a range of values of a sample statistic that is likely to contain a population parameter. In this case, a certain percentage of intervals that is referred to as the confidence level will include the population parameter in the long run (over repeated sampling). 

The Interpretation

confidence interval Interpretation

When you are using confidence intervals, then you need to understand that for any given sample size, the wider the confidence interval, the higher the confidence level. On the other hand, a narrower confidence interval or a more precise one needs to use either a lower level of confidence or a larger sample. 

Learn more about the different methods and types of sampling.

Let’s imagine that you have a sample that tells you that 52% of the participants stat they intend to vote for Party Y at the next election. As you can easily see, this figure is merely a sample estimate. 

The reality is that since this percentage came from a sample that has sampling error, then you need to allow a margin of error. So, when you use confidence interval, you can better estimate the interval within which the population parameter is likely to lie. 

As you can easily see, using confidence intervals prevents you from dealing with the confusing logic of null hypothesis testing and its simplistic significant/not significant dichotomy.

If you think about it, confidence intervals are actually a form of inferential analysis and they can be used with many descriptive statistics. These include percentages, correlation coefficients, regression coefficients, and percentage differences between groups. 

Just like tests of significance, confidence intervals always assume that the sample estimate comes from a simple random sample. So, you won’t be able to use them on data from non-probability samples. 


Discover how to find a confidence interval.

Why It Is Better To Use Confidence Intervals Than Significance Tests

Why It Is Better To Use Confidence Intervals Than Significance Tests
  • Confidence intervals provide all the information that a test of statistical significance provides and more. If at the 95 percent confidence level, a confidence interval for an effect includes 0 then the test of significance would also indicate that the sample estimate was not significantly different from 0 at the 5 percent level.
  • The confidence interval provides a sense of the size of any effect. The figures in a confidence interval are expressed in the descriptive statistic to which they apply (percentage, correlation, regression, etc.).
  • Since confidence intervals avoid the term ‘significance’, they avoid the misleading interpretation of that word as ‘important.’ Confidence intervals remind us that any estimates are subject to error and that we can provide no estimate with absolute precision.

Generative and Analytical Models for Data Analysis

When you think about data, it is important that you keep in mind that there are two different approaches that you can adopt: the generative and the analytical approach. 

data analysis

So, let’s take a look at each one of these models for data analysis.

Learn everything you need to know about statistics.

Generative Model For Data Analysis

Generative Model For Data Analysis

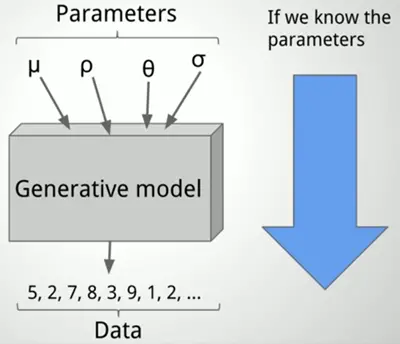
Simply put, when you use the generative model for data analysis, the process will focus on the process by which the analysis is created. This means that you need to develop an understanding of the decisions that you make from one step to the other so that you can recreate or reconstruct a data analysis. 

One of the things that you need to keep in mind about this model is the fact that it tends to take place inside the data analyst’s head which means that it can’t b observed directly. So, when you need to take measurements, you will need to ask the analyst directly. However, the main problem is that this is subjected to a wide range of measurement errors. Notice that on some occasions, you may have access to partial information when the analyst writes down the thinking process through a series of reports or if a team is involved and there is a record of communication about the process. 

Discover the different types of correlation.

This model tends to be quite useful for understanding the “biological process”, i.e. the underlying mechanisms for how data analyses are created, sometimes referred to as “statistical thinking”. 

Analytic Model For Data Analysis

Analytic Model For Data Analysis

With this approach, you will ignore the underlying processes that serve to generate the data analysis and you will focus on the observable outputs of the analysis. These outputs may be an R markdown document, a PDF report, or even a slide deck. 

The main advantage of using this approach is that the analytic outputs are real and can be directly observed. However, it’s worth noting that the elements placed in the report are the cumulative result of all the decisions made through the course of a data analysis.

Many people tend to refer to the analytical model for data analysis as the physician approach since it basically mirrors the problem that a physician confronts. 

Understanding predictive analytics.

What Is Still Missing?

What Is Still Missing?

After analyzing both models – the generative and the analytical models for data analysis, it is worth to state that we believe that something is still missing. 

The reality is that when you are gathering new data, you need to think about the answers that you’re trying to get. This ensures that you need to achieve a balance between matching the principles of both the analyst and the audience. So, summing up, for both the generative model and the analytical model of data analysis, the missing ingredient is a clear definition of what makes a data analysis successful. The other side of that coin, of course, is knowing when a data analysis has failed. 

Check out the ultimate guide to descriptive statistics.

While the analytical approach is useful because it allows you to separate the analysis from the analyst and to categorize analyses according to their observed features, the categorization is unordered unless we have some notion of success. 

On the other hand, the generative approach is useful because it reveals potential targets of intervention, especially from a teaching perspective, in order to improve data analysis. However, without a concrete definition of success, you don’t have a target to strive for and you do not know how to intervene in order to make genuine improvement.


Why You Need To Use High-Quality Data

As you already know, data is crucial. And when you are doing data science, you need to do research. Ultimately, you want to ensure that the data that you collect can answer a question, improve a current product, come up with a new one or identify a pattern. So, as you can easily understand, the common factor to all these is that you want to make sure that you use the data to answer a question that you haven’t answered before. 

Getting High-Quality Data

High-Quality Data

When you are trying to answer a question, the first thing you will do is to collect and then store it. However, you need to be careful about the storage process. After all, the state and quality of the data that you have can make a huge amount of difference in both how fast and how accurately you can get your answers. The truth is that if you structure the data for analysis, then you will be able to get your answers a lot faster. 

Learn everything you need to know about stats.

The truth is that you can get your data from many different sources and you will need to store it depending on the questions that you want to answer. 

Creating research quality data is the way that you refine and structure data to make it conducive to doing science. It means that the data is no longer as general purpose, but it means you can use it much, much more efficiently for the purpose you care about – getting answers to your questions.

getting data

Understanding covariance in statistics. 

When we talk about research quality, we are referring to data that is easy to manipulate and use, is formatted to work with the tools that you are going to use, is summarized the right amount, has potential biases clearly documented, is valid and accurately reflects the underlying data collection, and combines all the relevant data types you need to answer questions. 

One of the things that you need to pay attention to is when you are summarizing the data. The truth is that you need to know what are the most common types of questions that you want to answer as well as the resolution that you need to answer them. With this in mind, you may consider summarizing things at the finest unit of analysis you think you will need – it is always easier to aggregate than disaggregate at the analysis level. Besides, you should also need to ensure that you know what to quantify. 

Discover the Chi-square goodness of fit test.

Organizing Data The Right Way

Organizing Data The Right Way

The reality is that one of the main difficulties many people have is related to the organization of the data after they collect it. 

Ultimately, you just want to ensure that you can organize your data in a way that allows you to complete frequent tasks quickly and without large amounts of data processing and reformatting. 

Discover what you need to know about the F test.

Data-Quality

One of the things that you need to know about high-quality data and the ways you have to store it is that each data analytic tool tends to have different requirements on the type of data you need to input. For example, many statistical modeling tools use “tidy data” so you might store the summarized data in a single tidy data set or a set of tidy data tables linked by a common set of indicators. Some software (for example in the analysis of human genomic data) require inputs in different formats – say as a set of objects in the R programming language. Others, like software to fit a convolutional neural network to a set of images, might require a set of image files organized in a directory in a particular way along with a metadata file providing information about each set of images.


Sampling – The Different Methods & Types

Sampling is crucial in statistics. After all, samples are just parts of a population. 

Let’s say that you have information about 100 people out of 10,000 people. The 10 people represent your sample while the 10,000 represents the population. So, you can then use this sample to make some assumptions about the behavior of the entire population. 

Check out the top stats calculators online.

sampling

While this may seem a very simple process, the truth is that it isn’t. The reality is that you need to come up with a sample that has the right size. It can’t be too big or too small. However, the problems don’t end here. You then need to decide about the technique that you’re going to use to collect the sample from the population. 

In order to do this, you have different methods at your disposal:

#1: Probability Sampling: 

This sampling process simply uses randomization to select your sample members. 

#2: Non-Probability Sampling:

This sampling process isn’t random; it is based on the researcher. 

These are the best introductory statistics books.

Sampling Types

random-sampling

The reality is that you have many different sampling types. One of the things that you need to keep in mind is that these may include taking a sample with or without replacement. 

Here are some of the most common sampling types that you can use: 

#1: Bernoulli Samples:

These include independent Bernoulli trials on the population elements. With these trials, you will be able to determine who belongs to your sample and who doesn’t. However, all elements of the population have the same odds or chances of getting into the sample. 

Take a look at the top books for data science.

#2: Cluster Samples:

Cluster-sampling

As you can easily imagine by its name, this sampling types divides the population into clusters or groups. After that, you will need to have a random sample chosen from these clusters. This sampling type is usually used when the researcher knows the population groups or subsets but he doesn’t know the individuals in the population. 

#3: Systematic Sampling:

In this case, you can choose the sample elements from an ordered frame. 

#4: SRS: 

With the SRS sampling type, you will choose each one of the elements of your sample completely randomly. 

#5: Stratified Sampling: 

In this case, you will sample each subpopulation independently. 

These are the most common probability math problems.

How To Tell The Difference Between Different Sampling Methods

Step #1: 

The first thing you need to do is to discover if the study sampled from individuals. This may show you that this sampling was made using the random method or the systematic sampling method. 

Step #2: 

You will then need to figure out if the study picked groups of participants. When you have a large number of people, it may be easier to use the simple random sampling. 

Step #3: 

Determine if the study that you are looking at includes data from more than one defined group. Some real-life examples could be a study about renters and homeowners, democrats and republicans, country folks and city dwellers, among so many others. 

Now, just look at the data that you have. When you can see that you have data about the individuals in the groups, you have access to stratified data. So, you will need to perform random sampling. On the other hand, if you see that you only have information about the group in general, then you need to treat it as a cluster sample.  

Step #4: 

Finally, you will need to know if it was hard or easy to get the sample.